United States of America Solar Report

Gain comprehensive insights into the statistics and metrics surrounding the United States of America solar production industry.

  1. Climate Top. (2024). Sunshine & daylight hours in Los Angeles, California, USA. Retrieved from https://www.climate.top/usa/los-angeles/sunlight/
  2. Climate Top. (2024). Sunshine & daylight hours in New York, USA. Retrieved from https://www.climate.top/usa/new-york/sunlight/
  3. National Renewable Energy Laboratory (NREL). (2024). Utility scale PV. Retrieved from https://atb.nrel.gov/electricity/2023/utility-scale_pv
  4. Choose Energy. (2024). Electricity rates by state. Retrieved from https://www.chooseenergy.com/electricity-rates-by-state/
  5. National Renewable Energy Laboratory (NREL). (2024). Top 10 things to know about power grid reliability. Retrieved from https://www.nrel.gov/news/program/2024/top-10-things-to-know-about-power-grid-reliability.html
  6. Wood Mackenzie. (2024). American solar panel manufacturing capacity increases 71% in Q1 2024 as industry reaches 200-gigawatt milestone. Retrieved from https://www.woodmac.com/press-releases/2024-press-releases/us-solar-manufacturing-capacity-increase-to-71-percent/
  7. Fisher, A. (2024). US solar module manufacturing capacity grows by 11 GW in Q1. PV Magazine. Retrieved from https://www.pv-magazine.com/2024/06/07/us-solar-module-manufacturing-capacity-grows-by-11-gw-in-q1/
  8. Oguz, S. (2023). ENERGY SHIFT: Ranked: The cheapest sources of electricity in the U.S. Visual Capitalist. Retrieved from https://decarbonization.visualcapitalist.com/the-cheapest-sources-of-electricity-in-the-us/
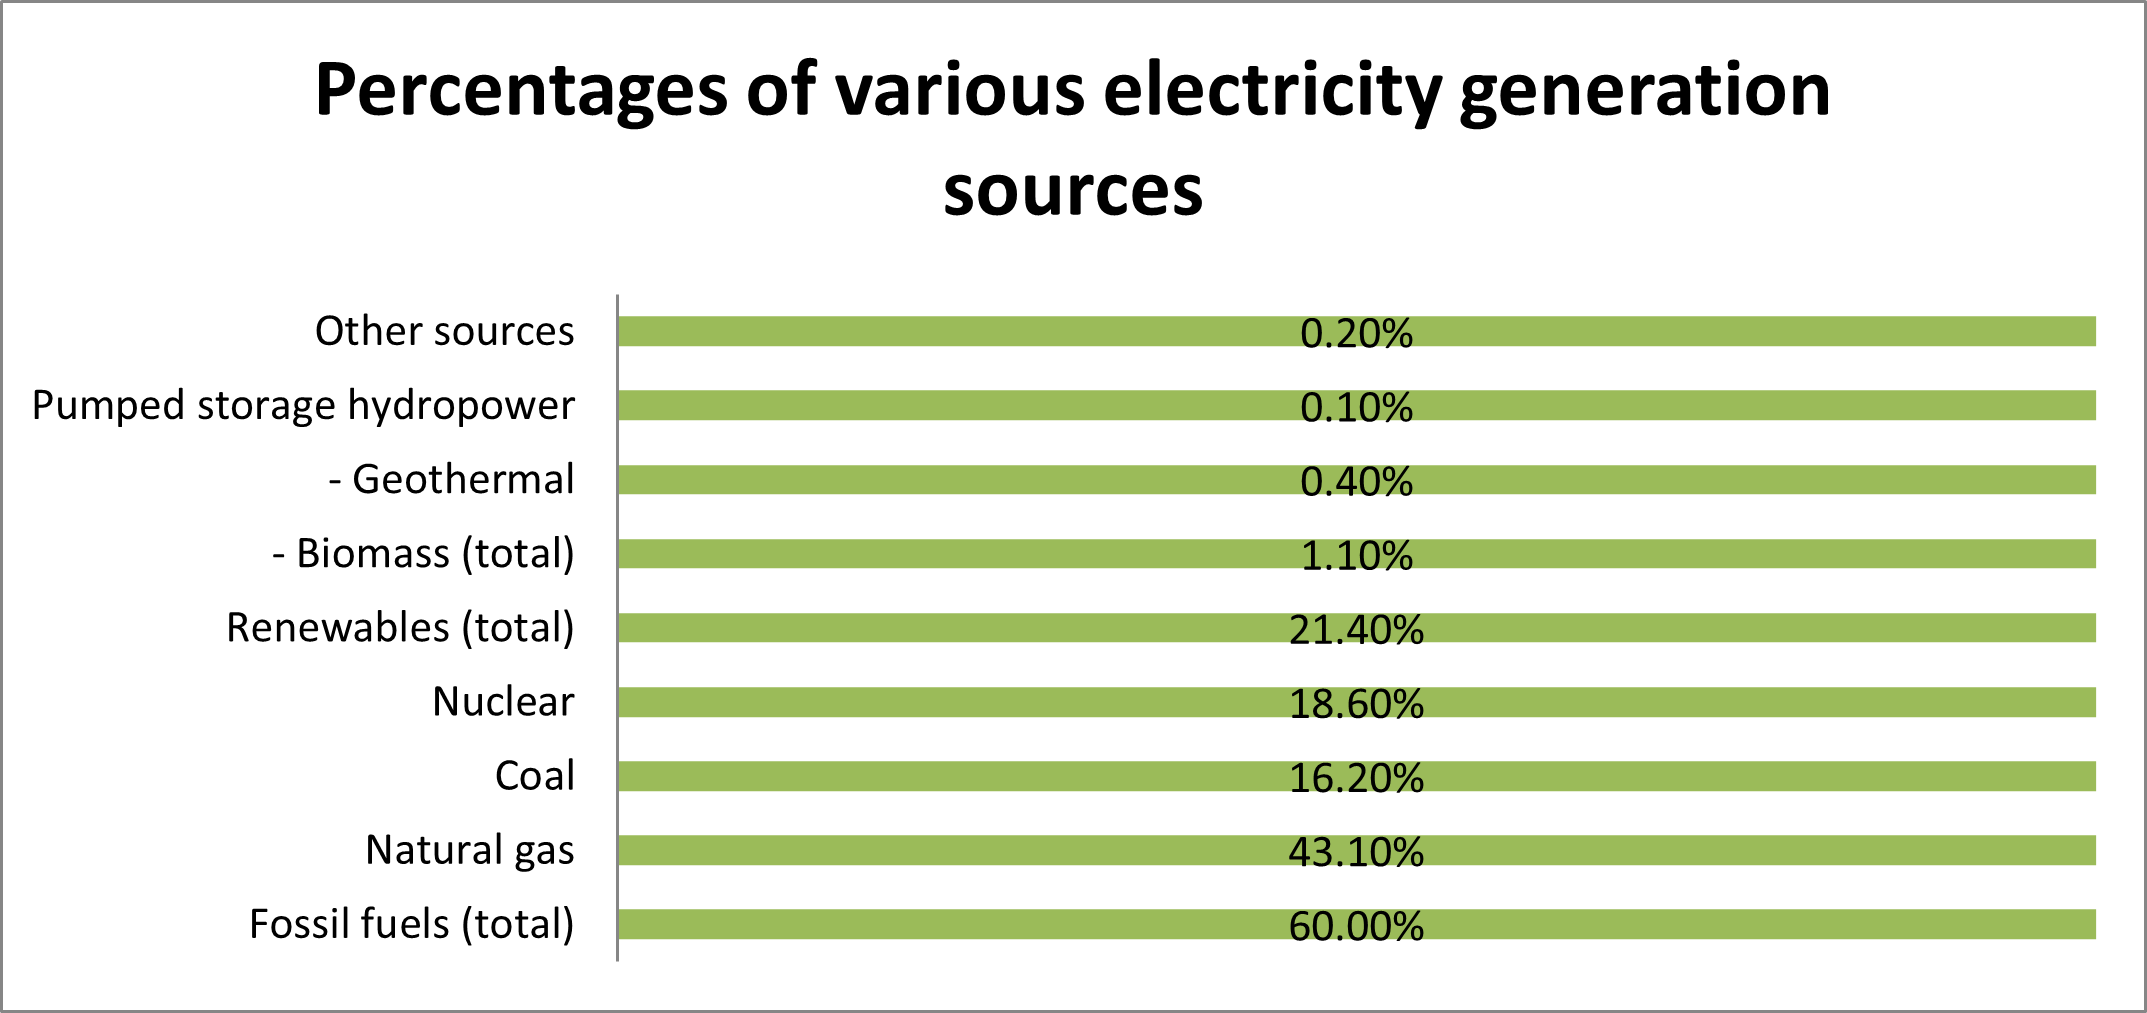
  9. U.S. Energy Information Administration (EIA). (2023). What is U.S. electricity generation by energy source? Retrieved from https://www.eia.gov/tools/faqs/faq.php?id=427&t=3
  10. U.S. Energy Information Administration (EIA). (2024). U.S. electricity customers averaged five and one-half hours of power interruptions in 2022. Retrieved from https://www.eia.gov/todayinenergy/detail.php?id=61303
  11. SolarInsure. (2024). How many Americans have solar panels in 2024? Retrieved from https://www.solarinsure.com/how-many-americans-have-solar-panels
  12. Solar Energy Industries Association (SEIA). (2024). Power American communities. Retrieved from https://www.seia.org/5M
  13. Evans, C. (2023). Amid record heat, solar farms help ease the strain on U.S. power grids. CBS News. Retrieved from https://www.cbsnews.com/news/solar-farms-electricity-ease-strain-u-s-power-grids-california-heat-temperatures
  14. U.S. Department of Energy. (n.d.). The United States’ clean energy goals. Retrieved from https://www.renewable-ei.org/pdfdownload/activities/01_Key_AlejandroMoreno.pdf
  15. Nesbit, J. (2024). The guide to off-grid homes. U.S. News & World Report. Retrieved from https://realestate.usnews.com/real-estate/articles/the-guide-to-off-grid-homes
  16. Vision Monday. (2023). Off-grid living is expected to put a strain on utilities. Retrieved from https://www.visionmonday.com/business/research-and-stats/article/offgrid-living-is-expected-to-put-a-strain-on-utilities/
  17. Solar Energy Industries Association (SEIA). (n.d.). Solar industry research data. Retrieved from https://www.seia.org/solar-industry-research-data
  18. Salary.com. (n.d.). Solar installer salary in the United States. Retrieved from https://www.salary.com/research/salary/posting/solar-installer-salary
  19. Worldometer. (2024). Population of America. Retrieved from https://www.worldometers.info/world-population/us-population/
  20. Britt, H. (2023). How much does it cost to rent a warehouse? Thomasnet. Retrieved from https://www.thomasnet.com/insights/how-much-does-it-cost-to-rent-a-warehouse/
  21. Electric Choice. (n.d.). See electricity rates and plans offered in your area. Retrieved from https://www.electricchoice.com/electricity-prices-by-state/
  22. Commercial Edge. (2024). July 2024 office market report. Retrieved from https://commercialedge.com/blog/national-office-report/
  23. U.S. Environmental Protection Agency (EPA). (2024). About the U.S. electricity system and its impact on the environment. Retrieved from https://www.epa.gov/energy/about-us-electricity-system-and-its-impact-environment.
  24. Council on Foreign Relations. (n.d.). How does the U.S. power grid work? Retrieved from https://www.cfr.org/backgrounder/how-does-us-power-grid-work
  25. World Bank Group. (2023). Access to electricity (% of population) – United States. Retrieved from https://data.worldbank.org/indicator/EG.ELC.ACCS.ZS?locations=US&most_recent_value_desc=true
  26. Townsley, A. (2024). Can we get a repeat of record-setting U.S. energy exports in 2024? CME Group. https://www.cmegroup.com/openmarkets/energy/2024/Can-we-get-a-repeat-of-Record-Setting-US-Energy-Exports-in-2024.html
  27. Smart, S. (2024). Solar energy toolkit: The federal and state context: Policies affecting solar energy development. Solsmart. https://solsmart.org/resource/the-federal-and-state-context-policies-affecting-solar-energy-development
  28. Sistine Solar. (n.d.). Understanding solar energy policies and regulations. Retrieved August 1, 2024, from https://sistinesolar.com/solar-energy-policies-and-regulations/
  29. U.S. Environmental Protection Agency. (n.d.). End-of-life solar panels: Regulations and management. Retrieved August 1, 2024, from https://www.epa.gov/hw/end-life-solar-panels-regulations-and-management
  30. U.S. Environmental Protection Agency. (n.d.). Policies and regulations. Retrieved August 1, 2024, from https://www.epa.gov/green-power-markets/policies-and-regulations
  31. Library Guides. (n.d.). Renewable energy industries: A research guide. Retrieved August 1, 2024, from https://guides.loc.gov/renewable-energy/regulations
  32. Certrec. (n.d.). Top ten largest solar farms in the United States. Retrieved August 1, 2024, from https://www.certrec.com/blog/certrec-market-research/top-ten-largest-solar-farms-in-the-united-states/
  33. Cox, D. (2023). 10 large solar projects in development for 2024.https://www.renewableenergyworld.com/solar/10-large-solar-projects-in-development-for-2024/

Key points

  • All figures have been converted into USD

Yearly sunshine (sun hours per year)

Yearly sunshine is also dependent on location in USA.

  • New York receives an average of 2,656 hours of sunlight per year, out of a possible 4,383, with an average of 7 hours and 16 minutes of sunlight per day.1
  • Los Angeles, California receives an average of 3,348 hours of sunlight per year, out of a possible 4,383, with an average of 9 hours and 9 minutes of sunlight per day.2

Read less

Figure 01 Average Sunlight Hours/ Day in New York.
Figure 02 Average Sunlight Hours/ Day in Los Angeles, California.

kWh per kWp installed

So, the kWh/kWp/year range in the U.S. spans from about 1,876 kWh/kWp/year to 2,978 kWh/kWp/year.3

Read more


Average cost per kWh from utility company

In the United States, the daily solar energy production per unit of installed capacity (kWh/kWp/day) varies across regions, ranging from:4

  • A minimum of approximately 5.14 kWh/kWp/day
  • A maximum of approximately 8.16 kWh/kWp/day

Read more


Reliability of electrical power supply grid

The US power grid boasts an impressive reliability record, with:5

  • Average annual power outage duration of less than 5 hours per customer
  • Average of less than 2 power outages per year
  • Overall reliability rate of 99.95%

Read less

This exceptional performance is attributed to the grid’s robust design, featuring:

  • Redundant pathways for electricity flow to ensure continuous supply
  • Backup power reserves to compensate for unexpected losses
  • Interconnected networks spanning large regions to share resources
  • Ability to withstand individual generator or transmission line failures without significant disruption

These design elements work together to provide a highly resilient and dependable electricity supply across the United States.


Detailed Information

  • All figures have been converted into USD
  • Total solar panel production capacity (installed)

    As of June 2024, the United States has reached a milestone of 200 gigawatts (GW) of installed US solar energy capacity, capable of powering over 36 million homes.6

    Total solar panel production capacity (projected)

    The US solar industry is projected to experience rapid growth, with anticipated annual installations of approximately 40 gigawatts (GW) of solar capacity over the next five years, culminating in a total installed capacity of 438 GW by 2029.7

    Average costs of various electricity generation sources (coal, natural gas, solar, etc)

    The cost of electricity generation in the United States varies by source, with the following costs per megawatt-hour (MWh):8

    • Onshore wind: $24-$75/MWh (more cost-effective than natural gas since 2015)
    • Utility-scale solar PV: $24-$96/MWh
    • Combined cycle natural gas: $39-$101/MWh
    • Geothermal: $61-$102/MWh
    • Coal: $68-$166/MWh
    • Offshore wind: $72-$140/MWh

    Note: These costs reflect the levelized cost of electricity (LCOE) for each source, representing the average cost of generating one megawatt-hour of electricity over the lifetime of the facility.

    Percentages of various electricity generation sources (coal, natural gas, solar, etc)

    About 60% of this electricity generation was from fossil fuels—coal, natural gas, petroleum, and other gases. About 19% was from nuclear energy, and about 21% was from renewable energy sources. A brief break down of and individual sources is given below.9

    A total breakdown of electricity generation sources is given below:

    Average daily availability of electricity from the national grid (measured in hours)

    US Energy Information Administration (EIA) reports:10

    • Average American household experienced 5.5 hours of power outages in 2022, a decrease of almost 2 hours from 2021.
    • Majority of outage time (over half) attributed to “major events” like extreme weather.
    • Excluding major events, average annual power outage duration has remained steady at approximately 2 hours per year from 2013 to 2021.

    Number of residential solar panel installations

    Current Installations11

    As of 2024, the United States has seen significant progress in residential solar energy adoption, with:

    • 2 million single-family homes equipped with solar installations
    • Out of a total of 84.69 million eligible homes

    Projected Installations12

    The Solar Energy Industries Association (SEIA) forecasts:

    • Residential solar panel installations in the US to reach 10 million by 2030
    • A more than twofold increase from current installation numbers
    • The percentage of US homes with solar panels to rise from 7% to over 15% by 2030

    Total number of solar farms (installed and projected)

    Installed Solar Farms13

    There are more than 5,000 solar farms across the U.S., according to the U.S. Energy Information Administration.

    Projected Solar Farms14

    Exact number is not available but targeted capacity of solar form for future is given as:

    • Over 116 GW of large-scale solar projects are currently under construction or in development.
    • More than 133 GW of major solar projects are already operational.

    Ambitious targets set for future solar capacity installations:

    • Average of 30 GW per year from now to 2025
    • Average of 60 GW per year from 2025 to 2030

    Off-grid market demand for solar panels (current and projected)

    The off-grid solar panel market in America is driven by the desire for cost-effective, sustainable living solutions.

    Current Demand15

    • The demand for off-grid solar panels in the United States is driven by over 250,000 individuals living off-grid, seeking cost savings and sustainable lifestyles.
    • Off-grid homes are more prevalent in rural areas where land is affordable and available, property taxes are low, and climates are temperate.
    • States like California, Colorado, Arizona, Oregon, Hawaii, Florida, Alaska, Utah, New Mexico, and New York are popular for off-grid living due to supportive laws and building codes.
    • Alabama, California, Missouri, and Alaska are highlighted as prime locations for off-grid living, offering ideal conditions with favorable policies and environments.

    Future Demand16

    • A recent (link unavailable) report predicts a significant increase in demand for off-grid solar panels in the US, with 12% of households expected to be off-grid by 2035, slightly outpacing Europe’s projected 11%.
    • This growth is driven by the rise of distributed energy resources and energy efficiency measures, which could reduce utility revenues by over $48 billion in the US by 2025.
    • While the shift to off-grid energy sources poses challenges for utility companies, the overall economic impact is expected to be limited, as only 12% of customers are projected to become energy self-sufficient by 2035.

    On-grid market demand for solar panels (current and projected)

    Current On-Grid Solar Panel Demand in America:17

    • Booming Industry: The U.S. solar industry is experiencing rapid growth, with over 200 gigawatts (GW) of solar capacity installed, powering more than 36 million homes.
    • Economic Impact: In 2023, the solar industry generated over $60 billion in private investment and employed more than 263,000 people.
    • Cost Decline: The cost to install solar has decreased by over 40% in the past decade, making it more accessible and competitive with other energy sources.
    • Predominant New Capacity: Solar accounted for 55% of all new electric capacity added to the grid in 2023, with expectations to maintain this trend in 2024.

    Projected On-Grid Solar Panel Demand:

    • Future Growth: More than 250 GW of new installations are expected by 2029, supported by the Inflation Reduction Act (IRA), which provides key tax credits and market certainty.
    • Utility-Scale Expansion: Over 30 GW of new utility-scale projects were installed in 2023, with continued strong demand from states, utilities, and corporations.
    • Residential and Commercial Markets: The residential market is diversifying, and emerging state markets will drive growth. The commercial market is set to expand due to the IRA’s incentives.
    • Storage Integration: By 2028, 28% of new distributed solar capacity will be paired with storage, up from 12% in 2023.
    • Manufacturing and Supply Chain: New U.S. module manufacturing capacity and investment in battery storage manufacturing will support future growth and address past supply challenges.

    Average monthly income of workers in solar industry (labor cost)

    The average Solar Installer salary in the United States is $70,466 as of June 27, 2024, but the salary range typically falls between $62,629 and $84,127. ​18

    Population of the country

    As of July 31, 2024, the population of the United States of America is 341,963,574.19

    Average overhead costs of solar panel production (with a brief breakdown)

    Estimate for Factory Rent20

    Average Warehouse Rental Cost

    As of 2023, the average base rental rate for warehouses in the United States is around $8.84 per square foot. Additionally, operating expenses, also known as NNN (Net, Net, Net) or CAM (Common Area Maintenance) charges, can increase the overall cost by $2 to $5 per square foot. This brings the total average cost to between $10.84 and $13.84 per square foot.

    Business Electricity Price21

    As of July 2024, the average commercial electricity rate in the United States is 11.03 cents per kilowatt-hour (kWh).

    Key Components of Administrative Costs

    Salaries and Wages18

    The average Solar Installer salary in the United States is $70,466 as of June 27, 2024, but the salary range typically falls between $62,629 and $84,127. ​

    Rent for Office Space22

    Here are some key insights into the average listing rate for office space in the United States as of July 2024:

    • National Average: The national average full-service equivalent listing rate was $31.67 per square foot in June 2024.
    • Highest Asking Rent: San Francisco had the second-highest asking rent nationally, averaging $60.99 per square foot.
    • Lowest Rental Rate: Detroit posted the lowest rental rate among leading U.S. office markets at $22.00 per square foot.

    A summary of the energy infrastructure

    Electricity Generation23

    • In 2023, the United States generated approximately 4.18 trillion kilowatt-hours (kWh) of electricity from utility-scale generators, supplemented by an additional 0.07 trillion kWh from small-scale solar photovoltaic (PV) systems.
    • Over the past decade, the sources of electricity generation in the U.S. have undergone significant changes, with fossil fuels, nuclear energy, and renewable energy sources all contributing to the country’s electricity output.
    • Electricity generation in the U.S. is primarily accomplished using steam turbines, which can be powered by a variety of fuels, including fossil and nuclear fuels, biomass, geothermal, and solar thermal energy.
    • Additionally, other technologies utilized to generate electricity include gas turbines, hydro turbines, wind turbines, and solar photovoltaics.

    Transmission & Distribution24

    • The transmission of electricity over long distances is facilitated by high-voltage transmission lines, which transport power from generating facilities to local substations.
    • These substations then convert the high-voltage electricity to a lower voltage through a process known as “stepping down,” enabling its distribution to nearby residential and commercial customers.
    • The United States’ electricity grid comprises a complex network of power lines that interconnect power plants with consumers across the country.
    • The grid is segmented into three primary regions: the Eastern Interconnection, the Western Interconnection, and the Texas Interconnected system.
    • Each region operates independently, with limited electricity exchanges between them, ensuring a reliable and efficient supply of power to meet regional demand.

    Energy Access25

    • As of 2021, the United States has achieved universal access to electricity, with 100% of the population having the ability to connect to the power grid.
    • This milestone indicates that virtually every individual in the country can access and utilize electricity to meet their daily needs, highlighting the widespread availability and reliability of the electrical infrastructure in the United States.

    Energy Exports26

    • According to the latest data from the Energy Information Administration (EIA), U.S. energy exports experienced a 7% increase in 2023, solidifying the country’s position as a significant energy supplier to the global market.

    Some of the government regulations surrounding solar panel production

    2728293031

    Federal Regulations

    Environmental Protection Agency (EPA) Regulations

    • Resource Conservation and Recovery Act (RCRA): Governs the disposal of hazardous waste, which includes certain chemicals and materials used in solar panel production. Manufacturers must manage waste materials properly to comply with RCRA regulations.
    • National Pollutant Discharge Elimination System (NPDES): Requires permits for discharges of pollutants into U.S. waters, which could apply to wastewater generated during solar panel manufacturing.

    Occupational Safety and Health Administration (OSHA) Standards

    • OSHA Regulations: Solar panel manufacturing facilities must adhere to OSHA standards to ensure worker safety. This includes regulations related to handling hazardous materials (e.g., cadmium in thin-film panels), equipment safety, and workplace safety protocols.

    Federal Trade Commission (FTC)

    • Green Guides: The FTC’s Green Guides provide guidelines on environmental marketing claims, including those related to solar panels. Manufacturers must ensure that their advertising and labeling claims about the environmental benefits of their products are truthful and substantiated.

    S. Department of Energy (DOE)

    • Energy Policy Act of 2005: Includes provisions for the development of energy-efficient technologies and research funding. The DOE sets efficiency standards for energy systems, including solar panels, which impact how products are designed and manufactured.

    Standards and Certifications

    Underwriters Laboratories (UL) Certification

    • UL 1703: This standard pertains to the safety of flat-plate photovoltaic modules and panels. It includes tests for fire resistance, electrical safety, and performance. Manufacturers must ensure their products meet UL 1703 to gain certification.
    • UL 61730: Focuses on the safety of photovoltaic panels, including their electrical and mechanical properties. This certification is essential for ensuring that panels meet safety standards for residential and commercial installations.

    International Electrotechnical Commission (IEC) Standards

    • IEC 61215: Specifies the requirements for the design qualification and type approval of silicon photovoltaic modules. It includes tests for performance under various environmental conditions, such as temperature and humidity.
    • IEC 61730: Addresses the safety requirements for photovoltaic modules, including electrical and mechanical safety.

    Crystalline Silicon Photovoltaic Modules – Standardization

    • IEC 61853: Covers the performance testing of solar panels, including efficiency and power output under standardized test conditions.

    Trade and Tariff Regulations

    Tariffs and Trade Policies

    • Import Tariffs: The U.S. has imposed tariffs on certain imported solar products, particularly from China, to protect domestic manufacturers. These tariffs can impact the cost of solar panels and influence production strategies for both domestic and international manufacturers.
    • Section 201 Tariffs: Implemented in 2018, these tariffs were designed to provide temporary protection for U.S. solar panel manufacturers by increasing the cost of imported panels. The tariff rates have varied over time and can affect the competitiveness of domestic manufacturers.

    Trade Agreements

    • USMCA: The United States-Mexico-Canada Agreement includes provisions related to trade in renewable energy technologies, including solar panels. These agreements can impact the flow of solar products across borders and affect the supply chain for U.S. manufacturers.

    Government initiatives in solar panel production (includes investments and subsidies)

    2728293031

    Federal Initiatives

    Investment Tax Credit (ITC)

    • Details: The ITC provides a 30% federal tax credit for the cost of solar energy systems installed on residential and commercial properties. This credit was extended and set to phase down over time, but recent legislation has extended it through at least 2032.
    • Recent Changes: The Inflation Reduction Act of 2022 extended the ITC at 30% through 2032, with a step-down to 26% in 2033 and 22% in 2034.

    Department of Energy (DOE) Solar Energy Technologies Office (SETO)

    • Details: SETO funds research and development projects aimed at reducing solar energy costs, improving performance, and integrating solar into the grid. SETO’s projects include advances in photovoltaic (PV) technology, solar manufacturing, and solar grid integration.
    • Recent Projects: SETO’s initiatives include funding for research into perovskite solar cells and the development of advanced solar manufacturing techniques.

    Loan Programs Office (LPO)

    • Details: The LPO provides loan guarantees for large-scale solar projects to encourage private investment. These loans cover up to 80% of a project’s cost and reduce financial risk.
    • Recent Loans: In 2021, the LPO approved a $1 billion loan guarantee for the Copper Mountain Solar Facility in Nevada, which is one of the largest solar farms in the U.S.

    Solar Energy Research and Development (R&D) Grants

    • Details: The DOE issues grants for solar R&D through programs like the SunShot Initiative. These grants support projects that aim to reduce the cost of solar energy to $0.03 per kilowatt-hour (kWh).
    • Recent Grants: The DOE awarded $100 million in grants for solar technology research in 2023, focusing on innovations such as solar panel recycling and energy storage integration.

    State and Local Initiatives

    California Solar Initiative (CSI)

    • Details: Launched in 2006, the CSI program offers rebates for solar installations on residential and commercial properties in California. The program has been instrumental in making California a leader in solar energy adoption.
    • Recent Updates: The CSI program has transitioned to the Self-Generation Incentive Program (SGIP), which continues to offer financial incentives for solar and energy storage systems

    New York State Solar Incentive Program

    • Details: New York offers various incentives, including the NY-Sun initiative, which provides direct incentives for residential and commercial solar installations and promotes solar development across the state.
    • Recent Changes: NY-Sun’s Community Solar Program has expanded to provide more access to solar for low-to-moderate-income households and renters.

    Texas Property Assessed Clean Energy (PACE)

    • Details: Texas PACE programs enable property owners to finance solar energy systems through property tax assessments. This program facilitates solar adoption by removing the upfront cost barrier.
    • Recent Developments: Texas has seen increased PACE financing for commercial solar projects, helping businesses invest in renewable energy.

    Massachusetts Solar Renewable Energy Certificates (SRECs)

    • Details: Massachusetts uses SRECs to incentivize solar installations. Solar system owners earn certificates for each megawatt-hour of solar energy produced, which can be sold to utilities to meet renewable energy requirements.
    • Recent Updates: Massachusetts has introduced the Solar Massachusetts Renewable Target (SMART) program, which provides a fixed per-kWh incentive for solar energy generation.

    Local Government Initiatives

    Denver Solar Rebate Program

    • Details: Denver offers rebates for residential solar installations, reducing the upfront cost for homeowners. This program is aimed at increasing solar adoption within the city.
    • Recent Changes: The city has expanded the program to include incentives for solar energy storage systems, promoting combined solar and battery installations.

    Seattle’s Solarize Program

    • Details: Seattle’s Solarize program provides bulk purchasing discounts and educational resources for residents interested in installing solar panels.
    • Recent Initiatives: The program has been updated to include low-interest financing options and increased outreach to underserved communities.

    Public-Private Partnerships

    The Solar Manufacturing Accelerator

    • Details: A public-private initiative aimed at boosting U.S. solar panel manufacturing by investing in domestic production facilities and technology innovation.
    • Recent Investments: In 2022, the Biden administration announced a $500 million investment in solar manufacturing through the Solar Manufacturing Accelerator, targeting increased production capacity and job creation.

    The Solar Energy Research Institute for India and the United States (SERIIUS)

    • Details: A collaborative research initiative between the U.S. and India focusing on solar energy technologies, with the aim of developing new technologies and reducing costs.
    • Recent Projects: SERIIUS has been working on advanced solar cell technologies and joint research efforts to improve solar energy efficiency.

    Notable solar projects in the country (installed and projected)

    Installed Projects32

    The Desert Sunlight Solar Farm

    • A 550-megawatt photovoltaic power station located about six miles north of Desert Center, California, in the Mojave Desert.
    • The project utilizes approximately 8.9 million cadmium telluride modules by First Solar and was completed in two phases, with Phase I having a capacity of 300 MW and Phase II having a capacity of 250 MW.
    • Additionally, a 230 MW battery storage power station was added in 2022.

    The Topaz Solar Farm

    • A 550 MW photovoltaic power station in San Luis Obispo County, California, with a total cost of $2.5 billion.
    • The project features 9 million CdTe photovoltaic modules manufactured by First Solar and is designed to generate power during the middle of the day when electricity demand is highest.
    • Pacific Gas and Electric will purchase the electricity produced under a 25-year power purchase agreement.

    Solar Star Project

    • A 579 MW photovoltaic power station near Rosamond, California, operated and maintained by SunPower Services.
    • Notably, it was the world’s largest solar farm in terms of installed capacity in 2015. Unlike other photovoltaic plants, Solar Star uses a smaller number of large form-factor, high-wattage, high-efficiency, higher-cost crystalline silicon modules.

    Mount Signal Solar

    • Also known as the ‘Imperial Valley Solar Project,’ is a 794 MW photovoltaic power station west of Calexico, California.
    • Developed and constructed by 8minutenergy Renewables in three phases, it is expected to be the world’s largest PV solar farm with a capacity of 800 MW upon completion.
    • The project has received support from several environmental groups due to its location on low-productivity farmland.

    The Copper Mountain Solar

    • Facility is an 802 MW solar photovoltaic power plant in Boulder City, Nevada, developed and owned by Sempra Generation.
    • Construction began in January 2010, and the plant spans 4,000 acres. It features 9 million First Solar panels and has an average capacity factor of 27.9%, with an annual net output of 1,348 GWh or 337 MWh per acre.
    • The facility is co-located with the 64 MW Nevada Solar One, 150 MW Boulder Solar, and 300 MW Techren Solar, forming a combined solar power capacity of over 1 GW, comparable to the generating capacity of the Hoover Dam at approximately 2 GW.

    Projected Projects33

    Eagle Eye Solar Project

    • Eagle, LLC, a subsidiary of BNC DEVCO, LLC, proposes the construction, ownership, operation, and decommissioning of the Eagle Eye Solar Project in La Paz County, Arizona.
    • The project encompasses a 400 MWac power generating facility, a 400 MW battery facility, and potentially a Hydrogen Energy Storage System (HESS).
    • Construction is scheduled to commence in December 2024 and is expected to be completed by June 2026.
    • According to the National Renewable Energy Laboratory (NREL), solar projects with co-located energy storage systems are estimated to cost $1,208/kW.
    • Based on this value, FirmoGraphs estimates the project’s cost to be approximately $650 million.

    Koshkonong Solar Energy Center

    • Koshkonong Solar Energy Center, a wholly-owned subsidiary of Invenergy, plans to construct the Koshkonong Solar Energy Center project on 6,384 acres of land in Dane County, Wisconsin.
    • The project includes a 300 MW solar electric generation facility and a 165 MW battery facility. Major components comprise PV panels, power conversion units, approximately 75 miles of 34.5-kilovolt underground collector circuits, a collector substation, and a new 0.84-mile 345 kV generator tie line.
    • Construction is expected to commence in the fall of 2024 and be completed by the end of 2026. The project’s estimated value is $649 million.

    Rocky Run Solar

    • Dominion Energy, Inc. will develop the proposed Rocky Run Solar project in Brunswick County, Virginia.
    • The project site spans approximately 10,000 acres of land and will generate up to 300 MW of electricity, sufficient to power 75,000 homes at peak output. Construction is expected to begin by 2024 and be in service by the end of 2025.

    Some of the notable solar companies (plus brief details on what they do)

    1.NextEra Energy

    • Website: nexteraenergy.com
    • Location: Juno Beach, Florida
    • 2022 Annual Revenue: $20.956 billion
    • Services: NextEra Energy provides a range of energy solutions, including solar power, wind energy, nuclear energy, and natural gas. They are known for delivering clean energy across North America and offering sustainable solutions to meet changing energy needs.

    2. Avangrid

    • Website: avangrid.com
    • Location: Portland, Oregon
    • 2022 Annual Revenue: $7.923 billion
    • Services: Avangrid focuses on utility-scale solar generation along with wind, thermal, and biomass energy. They are known for their vertically integrated approach to providing reliable and cost-effective renewable energy products. Avangrid is a part of the global Iberdrola Group.

    3. First Solar

    • Website: firstsolar.com
    • Location: Tempe, Arizona
    • 2022 Annual Revenue: $2.619 billion
    • Services: First Solar specializes in manufacturing thin-film photovoltaic solar panels and offers project development, operation, and maintenance services. They emphasize research and development to enhance solar technology and improve grid integration.

    4. SunPower

    • Website: sunpower.com
    • Location: Silicon Valley, California
    • 2022 Annual Revenue: $1.74 billion
    • Services: SunPower offers high-efficiency solar panels and provides solar system installation and monitoring for residential, commercial, and utility-scale projects. They also focus on solar storage solutions and have a strong emphasis on sustainability and innovation.

    5. Cypress Creek Renewables

    • Website: cypresscreekrenewables.com
    • Location: Research Triangle Park, North Carolina
    • 2021 Annual Revenue: $232 million
    • Services: Cypress Creek Renewables develops, finances, operates, and owns utility-scale and distributed solar power plants. They manage more than 2.5 gigawatts of solar energy and are involved in policy development and regulatory affairs to support their projects.

More about United States of America Solar Business

Our Services

Business Plan E-Course 

Learn more about our free e-Course here

Full Scale Solar Production Service

Learn more about our full scale production service here

Consulting Service

Learn more about our free consulting service here

Turnkey Service

Learn more about our free turnkey service here

Are you interested in starting your own solar module production line?

We can help you start your own solar module production company. With our 100% turnkey service, we will deliver the needed machines, do a technology transfer, provide expert and excellent support, and help you with the know-how needed to start even if you don't have any previous experience in this industry.

Start Your Own Solar Panel Production Line Today!

>