An entrepreneur considering a new venture often begins with a simple question: ‘What are the costs, and what is the potential revenue?’ In most industries, this calculation is straightforward. However, establishing a solar module factory in the United States today requires a far more nuanced approach.
A standard financial model that overlooks new government incentives and specific local operating costs won’t just be inaccurate—it will likely lead to a fundamentally flawed conclusion about the project’s viability.
Legislation designed to onshore the supply chain has reshaped the US market for solar manufacturing, creating a significant opportunity for those who can accurately model the new financial landscape. The key is recognizing that incentives like the Inflation Reduction Act (IRA) credits are not just a bonus—they are a core component of the business case.
The New Economics of US Solar Manufacturing
For years, the financial logic of solar manufacturing favored locations with lower labor costs and established supply chains. The passage of the Inflation Reduction Act (IRA) fundamentally altered this equation for projects based in the United States. This legislation aims to incentivize a robust domestic manufacturing ecosystem, from polysilicon production to final module assembly.

This strategic shift means a financial projection for a US solar factory is now a blend of traditional manufacturing economics and sophisticated incentive calculation. Investors and entrepreneurs must analyze not only the cost of machinery and materials but also the direct financial benefits from federal and state programs. This requires a purpose-built financial model that treats these credits as a primary variable, not an afterthought.
Core Components of a Robust Financial Model
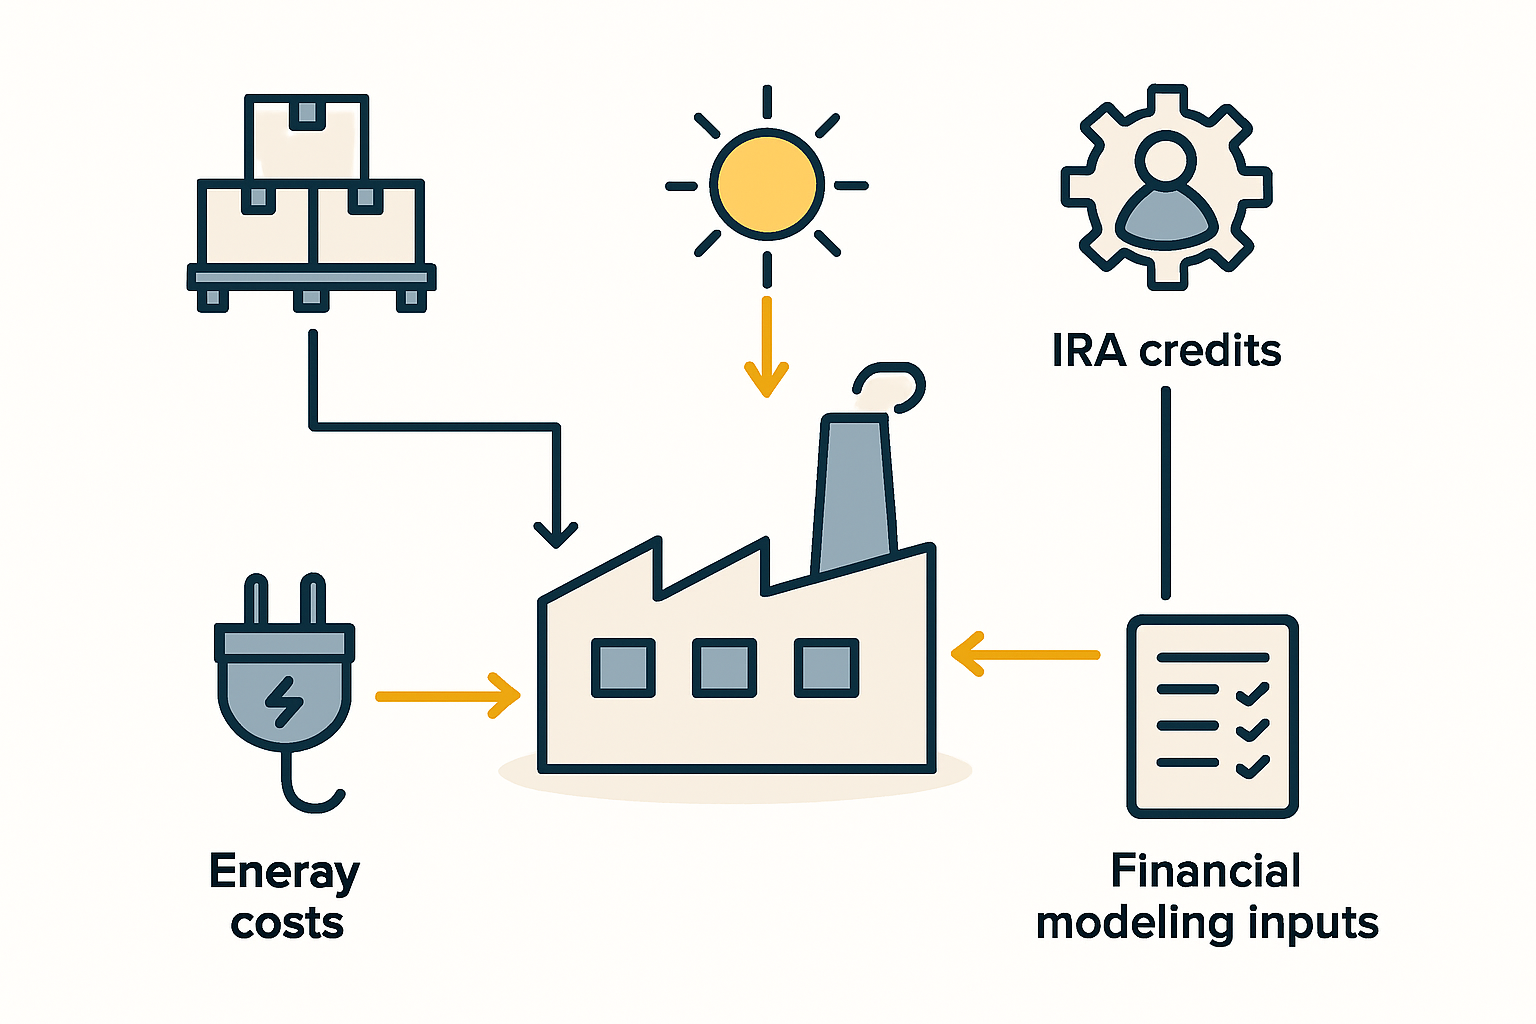
A comprehensive financial model for a US-based solar module factory must be built on four distinct but interconnected pillars. Neglecting any one of these can lead to a skewed perception of risk and return.
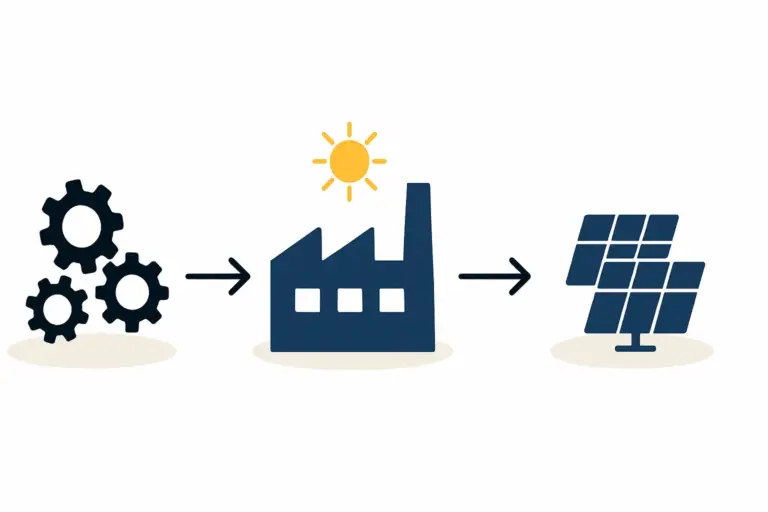
1. Capital Expenditure (CapEx): The Foundation of Your Investment
This covers the initial, one-time investment required to establish the facility. While familiar to any business professional, specific choices made here have long-term implications for operating costs in the US context.
Production Machinery: Key equipment includes stringers, laminators, and testers. The level of automation is a critical decision. A higher upfront investment in a fully automated turnkey production line can significantly reduce long-term labor costs, a major operating expense in the US.
Building and Infrastructure: The cost of land and construction varies dramatically by state and even county. A location in a designated development zone may offer lower real estate costs or tax advantages.
Ready to make big Profits?
The solar Industry is Booming
WE HELP NEWCOMERS to the solar industry start their own solar module production line. Customers can make BIG PROFITS by selling modules and finding investors, without wasting money and time on things they don't need!
Installation and Commissioning: This phase involves the setup, calibration, and testing of the production line. J.v.G. Technology’s experience with global turnkey projects shows this stage requires specialized engineering expertise to ensure the line meets its nameplate capacity and quality standards from day one.
2. Operational Expenditure (OpEx): The US-Specific Cost Landscape
This pillar accounts for the recurring costs of running the factory. It is here that the unique characteristics of the US market become most apparent.
Labor: US labor wages are higher than in traditional solar manufacturing hubs. A successful model must accurately forecast salaries for skilled technicians, engineers, and line operators, as well as associated costs like training, benefits, and compliance with local labor laws.
Energy: Electricity costs are a significant variable in manufacturing. States with lower industrial electricity rates, such as those in the Southeast or parts of the Midwest, can offer a distinct competitive advantage.
Bill of Materials (BOM): This covers all components for a solar module, such as solar cells, glass, backsheets, and aluminum frames. While some components may still be imported, the IRA encourages domestic sourcing. The model must account for the logistics and costs of both domestic and international supply chains.
Logistics and Shipping: Producing in the US eliminates costly and volatile international shipping for finished modules destined for the domestic market. This ‘Made in USA’ status is increasingly valued by large-scale solar developers, who may themselves benefit from using domestically produced components.
3. Revenue Projections: Beyond Per-Watt Pricing
Forecasting revenue involves more than simply multiplying production capacity by the current market price per watt.
Market Pricing for US Modules: Domestically produced modules often command a price premium. This is driven by demand from utility-scale and commercial projects seeking to qualify for their own domestic content bonuses under the IRA.
Product Mix: The type of solar module technology produced affects the selling price. High-efficiency modules, such as those using TOPCon or HJT cells, or bifacial modules for utility-scale projects, will have a different revenue profile than standard monofacial modules.
Offtake Agreements: Securing long-term purchase agreements with large buyers provides revenue stability and is a critical factor for securing project financing.
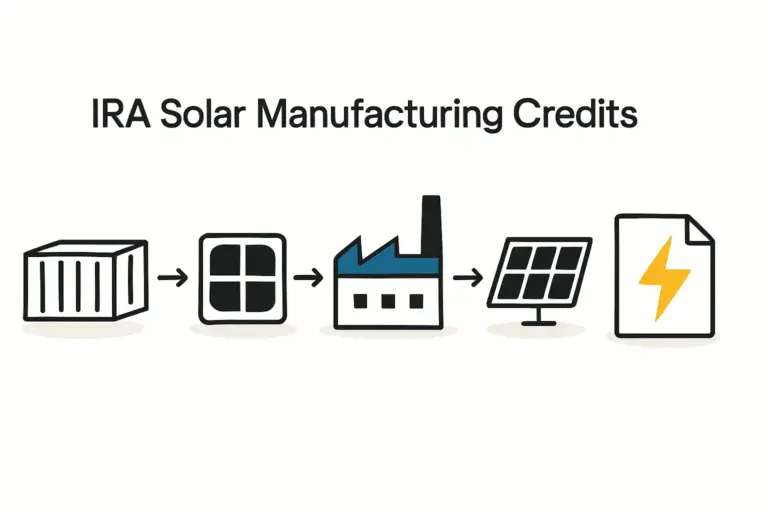
4. Government Incentives: The IRA Game-Changer
This pillar is the most transformative element of a modern US solar financial model. The IRA introduced direct-pay production tax credits that fundamentally improve a project’s profitability.
The 45X Advanced Manufacturing Production Credit: This is the most significant incentive, providing a direct credit for each US-made component produced and sold. For module manufacturers, the credit is calculated per watt of the completed module’s capacity. For instance, the credit is 7 cents per watt for a solar module. For a 500-watt module, this translates to a direct credit of $35. This credit is paid directly to the manufacturer, serving as a powerful boost to revenue or a reduction in the cost of goods sold.
The 48C Investment Tax Credit (ITC): An alternative to the 45X credit, this focuses on the initial investment. It provides a credit of up to 30% of the capital expenditure (CapEx) for building or upgrading a manufacturing facility. A project must typically choose between the 45X production credit and the 48C investment credit; they cannot be claimed for the same facility.
State and Local Incentives: Many states offer their own packages, including property tax abatements, job creation grants, or subsidized loans. These must be researched on a location-by-location basis.
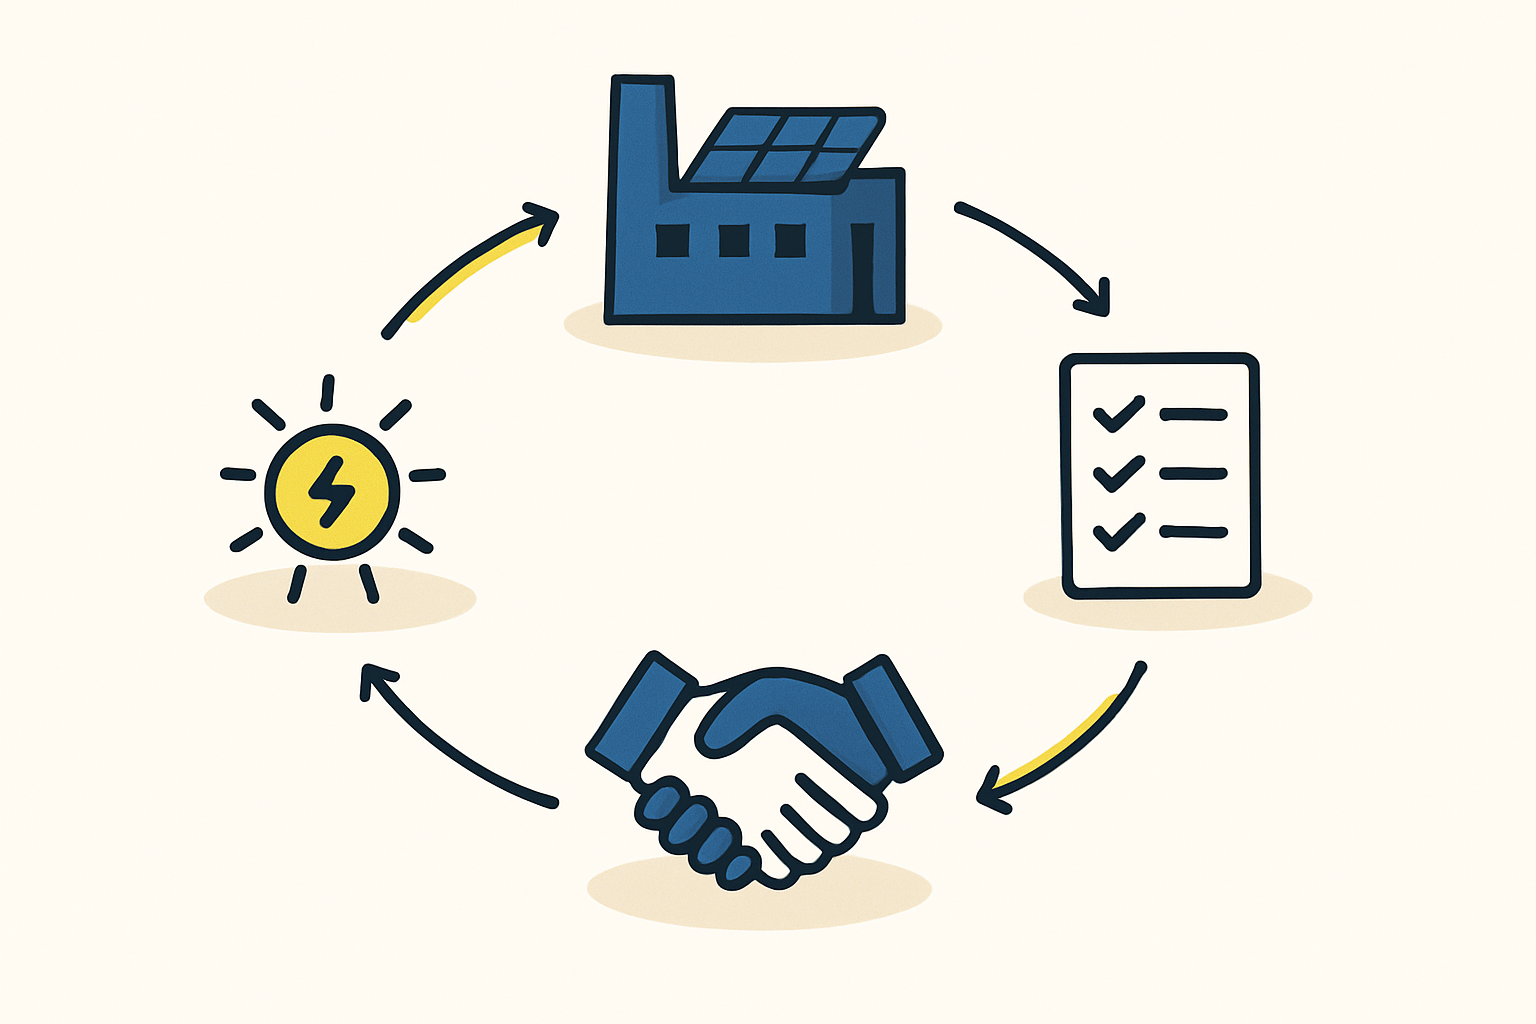
Integrating the Pieces: A Step-by-Step Approach
Building the model involves layering these components logically to project key financial metrics like Internal Rate of Return (IRR), payback period, and net profit.
- Establish a Baseline: Begin by modeling the project without incentives. Calculate the projected CapEx and the detailed operational costs (OpEx). Forecast revenue based on conservative market pricing for US-made modules. This establishes your pre-incentive business case.
- Layer in the 45X Credit: Integrate the 45X production credit into your cash flow projections. Multiply your annual production volume (in watts) by the relevant credit rate (e.g., $0.07/watt for modules). This new cash inflow will dramatically improve the project’s financial performance.
- Analyze the CapEx vs. OpEx Trade-off: Use the model to compare scenarios. For example, model a scenario with higher CapEx for a more automated production line against one with a lower initial investment but higher long-term labor costs. The results will often show that automation provides a faster payback period in the US market.
- Run Sensitivity Analysis: A robust model allows you to test variables. What happens if energy prices increase by 15%? What if the market price for modules declines by 10%? How does a 2-year delay in securing offtake agreements affect profitability? This analysis identifies the project’s most critical risks.
A common pitfall is focusing purely on the impressive figures of the IRA credits while underestimating the complexities of US operational costs. A successful model must balance both.
Frequently Asked Questions (FAQ)
What is the primary difference between the 45X and 48C credits?
The 45X credit is a production-based incentive paid out over time as you produce and sell goods (e.g., per solar module). The 48C credit is an upfront incentive based on the initial capital cost of building the factory. Generally, a facility can only claim one of these two major credits.
Does the 45X credit apply if I use imported solar cells in my US-assembled modules?
Yes. The 7 cents/watt credit is for the final assembly of the solar module in the United States, regardless of the origin of the cells. However, if you also manufacture the solar cells in the US, you can claim an additional credit of 4 cents/watt for the cells, bringing the total to 11 cents/watt.
How do I find reliable data for US labor and energy costs?
Official government sources like the U.S. Bureau of Labor Statistics (BLS) and the U.S. Energy Information Administration (EIA) provide reliable, region-specific data. This data is essential for creating accurate OpEx projections.
How does the IRA credit phase out over time?
The 45X credits begin to phase out for components sold after December 31, 2029. The credit will drop to 75% in 2030, 50% in 2031, 25% in 2032, and is eliminated entirely after that. This phase-out schedule must be factored into any long-term financial projection.
Conclusion and Next Steps
Developing a financial model for a US solar factory is no longer a simple cost-accounting exercise but a strategic task that requires a deep understanding of federal incentives, state-level cost variations, and global supply chain dynamics. The Inflation Reduction Act has created a historic opportunity, but capitalizing on it depends on accurate and comprehensive financial planning.
By building a model that properly integrates these new realities, entrepreneurs can move from initial curiosity to a confident, data-driven investment decision. The process is detailed, but with a structured approach, it becomes entirely manageable.
For those beginning this journey, exploring the specific technical and operational requirements for a solar module manufacturing plant is the logical next step. Understanding these details will provide the necessary inputs for the accurate financial model discussed here.