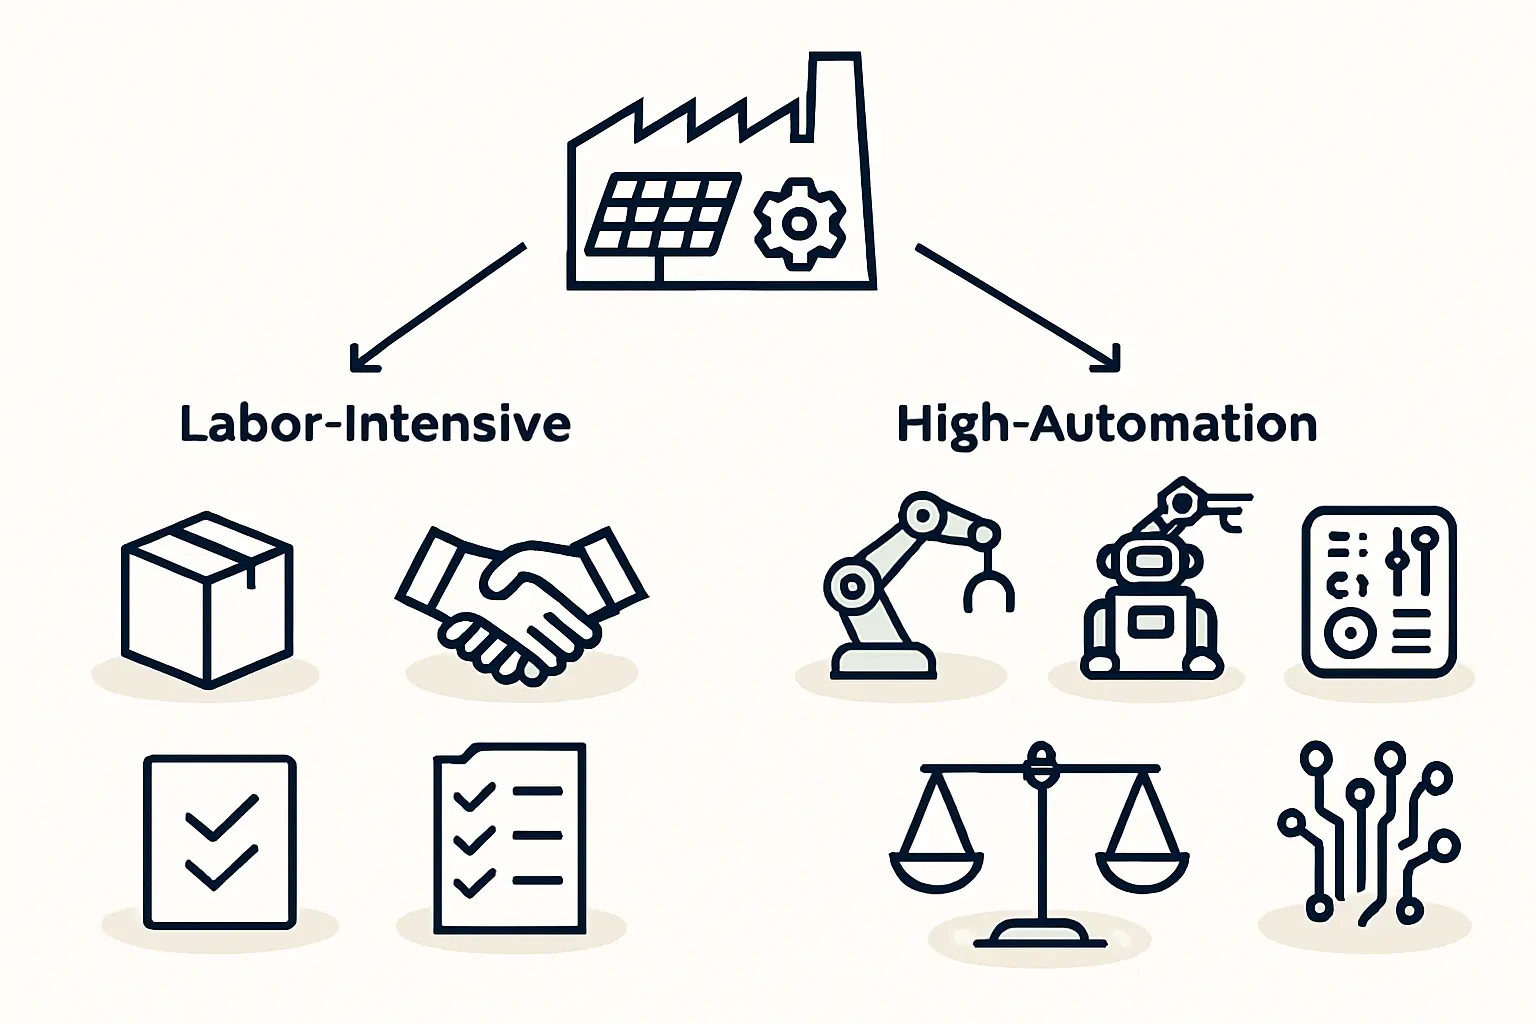
For entrepreneurs entering the solar manufacturing sector, a critical early decision centers on the production line—whether to invest in advanced automation or leverage the local labor market. This choice profoundly impacts capital expenditure, operational costs, and long-term profitability.
Using Kenya as a case study, this article provides a financial framework for analyzing this decision, helping investors navigate the trade-offs between machinery and manpower for a 50 MW solar module factory.
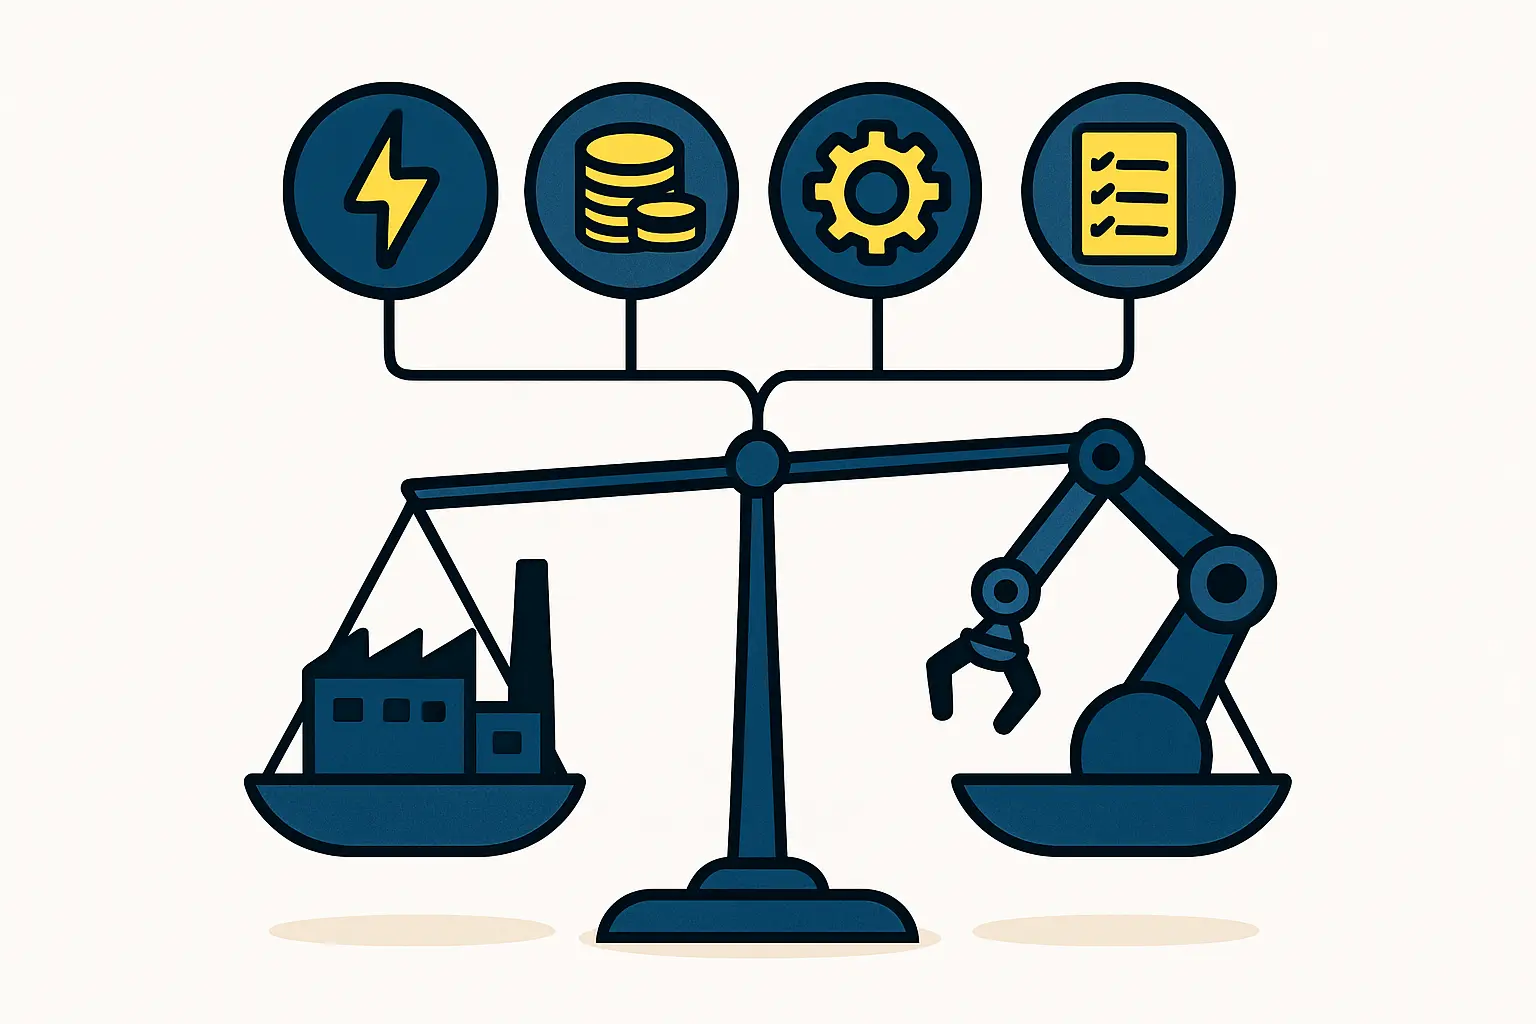
The Strategic Crossroads: Capital Expenditure vs. Operational Expenditure
At its core, the decision between automation and manual labor is a classic business trade-off between two types of costs:
Capital Expenditure (CAPEX):
The upfront investment required to purchase assets. For a solar factory, this means the cost of manufacturing machines and related equipment. A highly automated line has a significantly higher CAPEX.
Operational Expenditure (OPEX):
The ongoing costs of running the business, such as salaries, utilities, and maintenance. A labor-intensive production line will have higher OPEX related to wages and employee management.
Understanding how to balance these two financial levers is key to building a sustainable and profitable solar factory, particularly in an emerging market.
Analyzing the Capital Investment (CAPEX)
The most immediate difference between the two approaches is the upfront cost. Based on data from J.v.G. Technology GmbH projects, the difference is substantial.
A standard 50 MW line relies more on manual operations for processes like cell stringing and bussing. In contrast, a highly automated 50 MW line, which uses robotics for tasks like material handling and soldering, can increase the initial CAPEX by 20-35%.
For example, if a standard line’s equipment costs approximately $3.5 million, a comparable automated line could require an investment closer to $4.5 million. This additional $1 million must be justified by long-term operational savings and productivity gains. The initial investment for a solar factory is heavily influenced by this strategic choice from the start.
Deconstructing the Labor Component (OPEX)
Kenya’s labor market offers a compelling case study. The World Bank noted in 2023 that the country has a large, youthful, and trainable labor pool, which presents a significant opportunity for manufacturers.
According to 2022 data from the Kenya National Bureau of Statistics (KNBS), the average monthly earnings in the private manufacturing sector were approximately KES 48,000 (around $360 USD at the time).
Let’s model the direct labor costs for a 50 MW factory:
-
Standard Line: Typically requires 40-50 direct labor employees. At 45 employees, the annual direct wage cost would be approximately $194,400 (45 employees x $360/month x 12 months).
-
Automated Line: May only require 15-20 employees, primarily for oversight and quality control. At 18 employees, the annual direct wage cost would be around $77,760 (18 employees x $360/month x 12 months).
However, direct wages are only part of the story. Market analysis indicates that employee turnover in the Kenyan manufacturing sector can be as high as 15% annually. This creates additional recurring costs for recruitment and training, which must be factored into the operational model for a labor-intensive setup.
The Automation Alternative: Productivity, Precision, and Hidden Costs
The primary arguments for automation are increased productivity and consistent quality. The International Labour Organization (ILO) reports that automation can enhance manufacturing productivity by 15-30%. Robotic systems perform repetitive tasks with high precision, potentially reducing material waste and improving the final module’s quality and reliability.
However, automation comes with its own set of operational costs. The maintenance budget for a highly automated line is significantly higher than for a standard one.
-
Standard Line Maintenance: Typically 1-2% of CAPEX annually. For a $3.5M line, this is $35,000 – $70,000.
-
Automated Line Maintenance: Typically 3-5% of CAPEX annually. For a $4.5M line, this is $135,000 – $225,000.
This hidden operational cost can nearly offset the savings in direct wages. Furthermore, automated systems require specialized maintenance technicians. These skilled professionals command higher salaries and may be more difficult to source and retain in some regions, adding another layer of complexity to the operational plan.
A Practical Case Study: Balancing Strategy in Nairobi
One client’s experience vividly illustrates these trade-offs. Mr. Abdi, an entrepreneur in Nairobi, initially leaned toward a labor-intensive model. He had two goals: to manufacture solar panels and to create stable jobs in his community.
He opted for a standard production line. While this approach succeeded in creating employment, his team soon discovered that maintaining consistent quality control across three shifts was more challenging than anticipated. The costs of continuous training and supervision to reduce human error became a significant, recurring operational expense. This real-world example highlights that the ‘cheaper’ labor option on paper carries significant indirect costs related to management overhead and quality assurance.
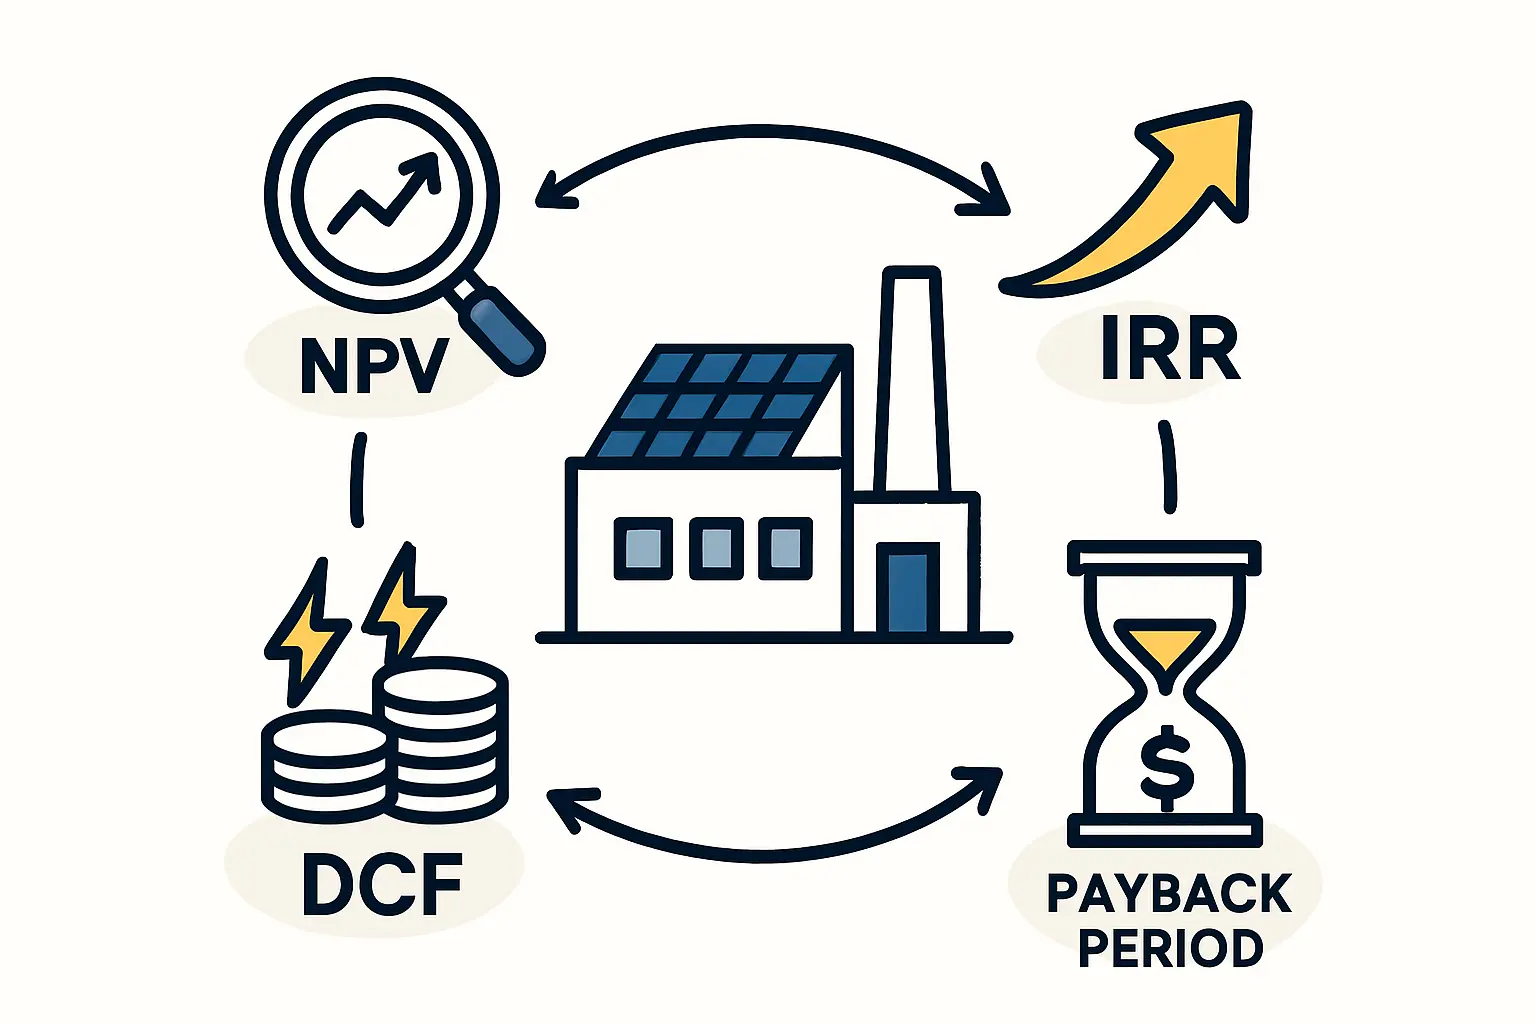
Building the Financial Model: A 5-Year Outlook
To make an informed decision, an investor should model these costs over a multi-year horizon, typically 5 to 10 years. A simplified comparison might look like this:
Standard Labor-Intensive Line
Initial CAPEX: ~$3.5 Million
Annual Direct Wages: ~$195,000
Annual Maintenance: ~$50,000
Other Considerations: Ongoing training, HR overhead
Highly Automated Line
Initial CAPEX: ~$4.5 Million
Annual Direct Wages: ~$78,000
Annual Maintenance: ~$180,000
Other Considerations: Higher cost of skilled technicians
This simplified model shows that while the automated line offers over $100,000 in annual wage savings, it incurs over $130,000 in additional annual maintenance costs. The breakeven point—where the higher initial investment in automation pays for itself through operational efficiencies—often lies several years in the future.
The final decision depends heavily on an investor’s access to capital, long-term business strategy, and local market dynamics. A comprehensive solar panel manufacturing business plan is crucial for modeling these scenarios accurately.
Frequently Asked Questions (FAQ)
What is the typical number of employees for a 50 MW solar factory?
A standard 50 MW factory generally requires 40-50 direct labor employees per shift. A highly automated facility of the same capacity might operate with as few as 15-20 employees, who are often in more supervisory or technical roles.
Does automation completely eliminate the need for manual labor?
No. Automation shifts the workforce demand from general labor to skilled technicians. While robots handle tasks like cell stringing and material transport, humans are still essential for quality assurance, machine maintenance, programming, and overall line supervision.
How does the choice between labor and automation affect product quality?
Automation typically offers higher consistency and precision, which can lead to more uniform product quality and fewer defects. However, a well-managed and properly trained manual workforce, supported by robust quality control processes, can also produce high-quality solar modules that meet international certification standards.
Is it difficult to find skilled maintenance staff for automated lines in a market like Kenya?
This can be a challenge and must be addressed during the planning phase. The operational plan for an automated factory should include a strategy for recruiting, training, and retaining skilled technicians. This might involve partnering with local technical colleges or providing specialized training programs as part of the project setup.
Conclusion: Making an Informed Decision
The choice between a labor-intensive and an automated solar factory is complex, with no single right answer. In a market like Kenya, the availability of a trainable workforce makes a compelling case for a standard production line, especially for investors looking to make a social impact through job creation.
However, the long-term benefits of automation—such as consistent quality, higher throughput, and reduced dependency on a large workforce—are hard to ignore. The right path depends on an investor’s financial position, risk appetite, and strategic objectives.
Ultimately, a thorough feasibility study is essential. By modeling the full spectrum of costs over the project’s lifespan, from initial investment to ongoing maintenance and labor, an entrepreneur can make a data-driven decision that aligns with their business goals. A flexible turnkey solar manufacturing line can be configured to match either strategy, but the choice must be made with a clear understanding of its long-term financial and operational consequences.