While Nepal is renowned for its immense hydropower resources, a significant and often overlooked opportunity lies in its solar energy potential. For entrepreneurs and investors, local solar module manufacturing represents a strategic entry into the country’s drive for energy diversification and independence. This naturally raises the question of financial viability.
This article presents a sample cost-benefit analysis for establishing a 50-megawatt (MW) solar module assembly plant in Nepal. We outline the key financial components, from initial investment to operational revenue, to help stakeholders grasp the potential returns. Please note these figures are illustrative and serve as a foundational model; a detailed feasibility study is essential for any specific project.
Key Assumptions for the Financial Model
Any robust financial projection rests on a clear set of assumptions. For this analysis, we’ve used the following conservative parameters for a new facility located in an industrial area near Kathmandu.
- Production Capacity: 50 MW per annum, operating on a single 8-hour shift.
- Technology: Mainstream Passivated Emitter and Rear Cell (PERC) technology using M10-sized solar cells.
- Market Focus: Primarily serving the domestic Nepalese market, which has a growing demand for reliable power solutions.
- Facility: A leased industrial building of approximately 3,500 square meters to reduce initial capital outlay.
- Currency: All financial figures are presented in USD for international comparability.
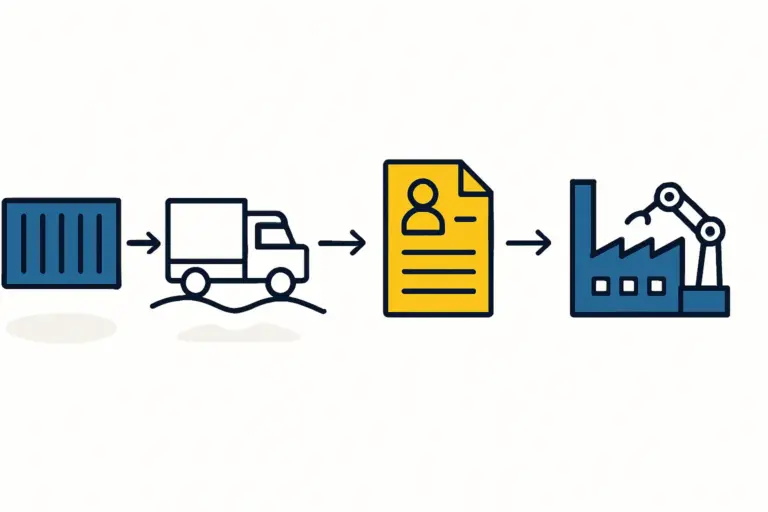
Estimated Capital Expenditure (CAPEX)
Capital expenditure is the one-time investment required to set up the production facility—the foundational cost incurred before the first module comes off the line.
Production Machinery
The production machinery forms the core of this investment. A complete turnkey solar production line for a 50 MW capacity includes essential equipment such as a solar cell stringer, bussing and layup stations, an EL tester, a laminator, and a sun simulator. Based on J.v.G. Technology’s experience with similar projects, a reliable European-standard line falls within a predictable budget.
Installation, Commissioning, and Training
Sourcing the machinery is just the first step. Professional installation, commissioning to ensure the line runs at its specified capacity, and comprehensive staff training are critical for success. This phase typically involves expert engineers overseeing the entire solar panel manufacturing process setup.
Ancillary Costs
This category covers essential support infrastructure:
- Initial Raw Materials Stock: A three-month supply of the Bill of Materials (BOM) is crucial to ensure production continuity.
- Factory Fit-Out: Electrical systems, compressed air supply, and office furnishings.
- Logistics and Contingency: Costs for shipping machinery to Nepal, customs clearance, and a contingency fund (typically 10-15% of the total CAPEX) for unforeseen expenses.
Sample CAPEX Breakdown for a 50 MW Plant:
| Category | Estimated Cost (USD) | Notes |
|---|---|---|
| Production Machinery | $2,000,000 – $2,500,000 | Core equipment for the 50 MW line. |
| Installation & Commissioning | $250,000 – $350,000 | Includes expert supervision and training. |
| Initial Raw Materials Stock | $700,000 – $900,000 | Covers cells, glass, backsheets, etc. |
| Logistics & Customs | $200,000 – $300,000 | Dependent on origin and local duties. |
| Contingency Fund | $300,000 – $450,000 | A prudent buffer of 10-15%. |
Total Estimated CAPEX: $3,450,000 – $4,500,000
Notes: Illustrative total investment.
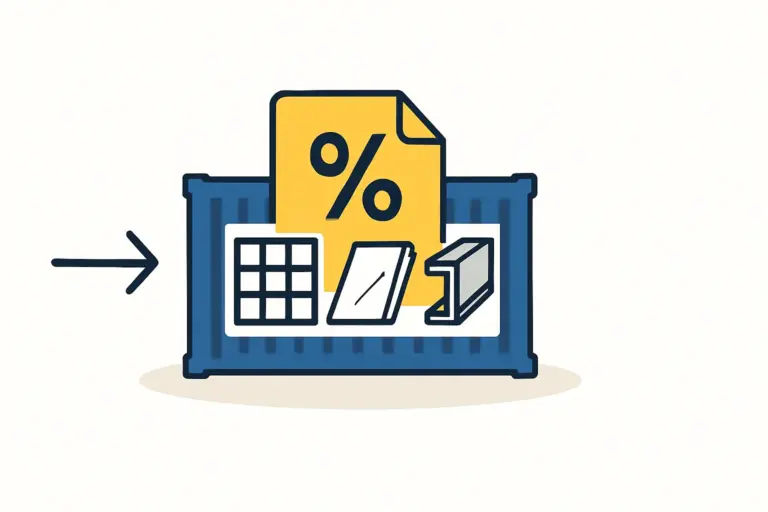
Projected Operational Expenditure (OPEX)
Operational expenditure covers the recurring annual costs of running the factory. Managing OPEX efficiently is key to long-term profitability.
Raw Materials (Bill of Materials – BOM)
The BOM is the single largest component of OPEX, typically accounting for 70-80% of the cost per module. The bill of materials for a solar panel includes solar cells, tempered glass, encapsulant (EVA), backsheet, aluminum frames, and a junction box. The global price of solar cells is the most volatile element and requires careful supply chain management.

Labor Costs
A semi-automated 50 MW line requires a skilled workforce. A team of approximately 25-30 individuals is needed, including line operators, technicians, quality control engineers, and administrative personnel. Labor costs in Nepal are competitive, offering a significant advantage over manufacturing in more developed nations.
Utilities and Overheads
These costs include factory rent, electricity, administrative salaries, maintenance, insurance, and local taxes. In a region with an unstable grid, factoring in the cost of backup power generation is a practical necessity.
Sample Annual OPEX Breakdown (at Full 50 MW Capacity):
| Category | Estimated Annual Cost (USD) | Notes |
|---|---|---|
| Raw Materials (BOM) | $11,000,000 – $13,000,000 | Based on a cost of ~$0.22-0.26 per watt. |
| Labor Costs | $150,000 – $200,000 | For a staff of 25-30 employees. |
| Utilities & Overheads | $250,000 – $350,000 | Includes rent, energy, and admin. |
Total Estimated OPEX: $11,400,000 – $13,550,000
Notes: Illustrative annual running costs.
Revenue Projections and Profitability Analysis
With the cost structure in place, the final step is projecting revenue and assessing profitability.
Revenue Calculation
Revenue is calculated by multiplying the total power output produced and sold by the average selling price per watt.
- Annual Production: 50 MW = 50,000,000 watts.
- Average Selling Price (ASP): The market price for locally manufactured solar modules in Nepal could be around $0.30 – $0.34 per watt, a competitive price point against imported panels that incur transport costs and import duties.
- Total Annual Revenue: 50,000,000 W * $0.32/W = $16,000,000 (using a mid-range price).
Profitability and Payback Period
By subtracting annual OPEX from annual revenue, we can determine the gross profit.
- Annual Gross Profit: $16,000,000 (Revenue) – $12,475,000 (mid-range OPEX) = $3,525,000.
- The simple payback period is found by dividing the total initial investment (CAPEX) by the annual gross profit.
- Payback Period: $3,975,000 (mid-range CAPEX) / $3,525,000 (Annual Gross Profit) ≈ 1.13 Years.
This simplified model indicates a very attractive payback period. While this calculation doesn’t account for factors like depreciation, taxes, or financing costs, it clearly demonstrates the strong underlying business case.

The Strategic Context: Why This Model Works in Nepal
This financial model is especially viable because of Nepal’s specific market conditions:
-
Growing Energy Demand: The country faces a significant gap between electricity supply and demand, making off-grid and grid-tied solar solutions highly attractive.
-
Government Support: Policies promoting renewable energy can include tax incentives, preferential treatment for locally produced goods in government tenders, and subsidies.
-
Import Substitution: Local manufacturing reduces reliance on imported modules, strengthening the national economy and improving energy security.
-
Geographic Positioning: A manufacturing base in Nepal could potentially serve neighboring markets in South Asia over the long term.
Frequently Asked Questions (FAQ)
1. How reliable are these financial figures?
These figures are illustrative, based on current market averages for equipment and materials. A formal business plan would require obtaining specific quotations, conducting a detailed local market analysis, and assessing logistical costs to build a precise project budget.
2. What is the biggest financial risk in this business model?
The primary risk is the price volatility of the Bill of Materials—especially solar cells, which are traded as a global commodity. A secondary risk comes from market competition from large-scale international manufacturers. A strong local brand and quality assurance can help mitigate this.
3. Can a 50 MW plant be profitable operating only one shift?
Yes, as the model shows. However, profitability and return on investment (ROI) improve significantly with a second or third shift. This maximizes the use of the capital-intensive machinery with only a marginal increase in fixed costs.
4. How does financing impact this model?
This model assumes the project is financed through equity. If debt financing is used, interest payments must be factored into operational expenses, which extends the payback period. However, leverage can also increase the overall return on equity for investors.
5. What kind of support is necessary to launch a project like this?
A successful launch requires a combination of a solid business plan, adequate financing, and a reliable technical partner. An experienced partner like J.v.G. Technology can de-risk the project by providing proven turnkey production lines, engineering support, and hands-on training, ensuring the facility meets international quality standards from day one.