Disclaimer: This case study represents a composite example derived from real-world
consulting work by J.v.G. Technology GmbH in solar module production and factory optimization. All data points are realistic but simplified for clarity and educational purposes.
For many entrepreneurs considering the solar manufacturing sector, the initial vision is clear: a modern factory producing high-quality solar modules. However, the path from concept to a bankable business plan is often a complex financial journey. The most critical question is not ‘Can it be done?’ but rather, ‘Is it financially viable?’ Without a robust financial model, even the most promising venture can fail to secure funding or achieve profitability.
This is especially true in emerging solar markets like Tunisia, where opportunity is balanced by unique local variables. A successful investment case requires more than just machinery costs; it demands a comprehensive analysis of everything from local labor rates and international logistics to the specific requirements of development finance institutions.
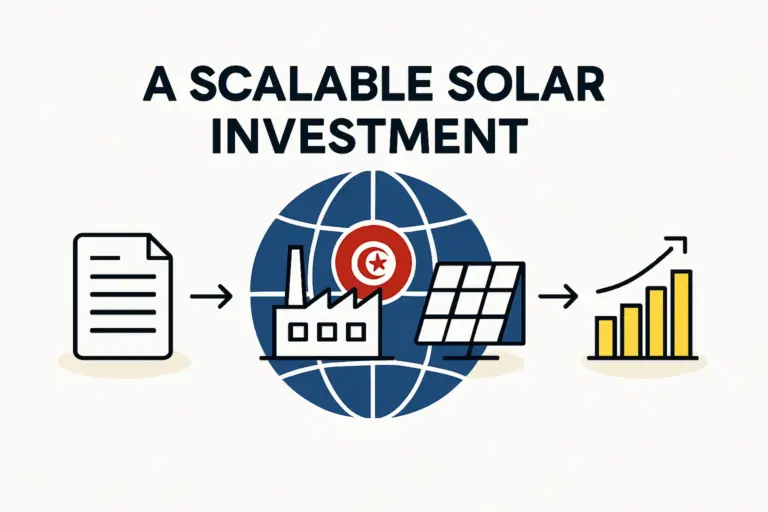
This article provides a structured framework for building such a model, using a hypothetical 50 MW solar module factory in Tunisia as a practical example. It outlines the essential components—from capital expenditures to projected returns—to offer a clear roadmap for investors.

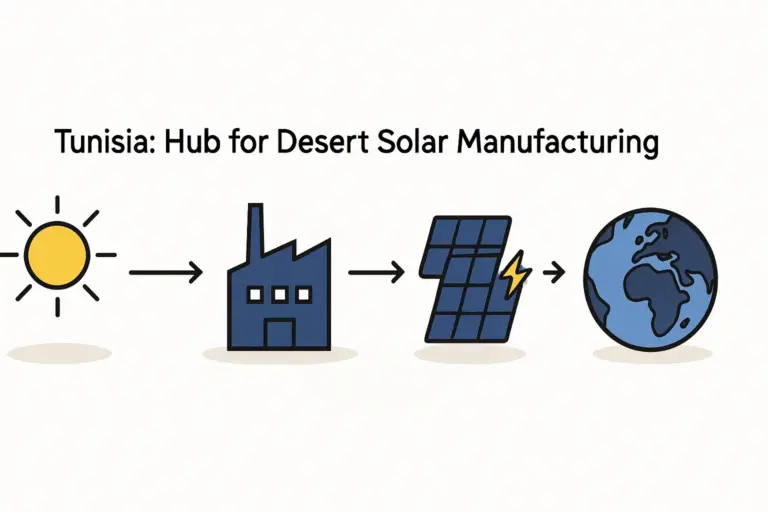
The Strategic Case for Tunisia
Tunisia’s position as a potential hub for solar manufacturing stems from a combination of government policy, geographic advantage, and market demand. According to Tunisia’s 2030 energy strategy, the country aims to generate 35% of its electricity from renewable sources, creating substantial domestic demand for solar modules.
Several other factors make it an attractive location for investment:
- Geographic Proximity: Situated at the crossroads of Europe, the Middle East, and Africa, Tunisia offers preferential access to key export markets. The Agadir Agreement and trade agreements with the EU can significantly reduce tariffs and logistical hurdles.
- Government Incentives: The Tunisian Investment Law provides a range of benefits for strategic projects, including potential tax exemptions for up to 10 years and state participation in infrastructure costs.
- Skilled Labor: The country boasts a well-educated, technically proficient workforce. Compared to European standards, competitive labor costs are a critical advantage in managing operational expenditures.
- Growing Energy Needs: With increasing industrialization and a national grid under pressure, there is strong support for decentralized solar energy projects that can be supplied by local manufacturers.
Building the Financial Model: A Step-by-Step Framework
A credible financial model is the foundation of any successful investment proposal. It translates an operational plan into a clear financial narrative, allowing investors and lenders to assess risk and potential returns. The model rests on three primary pillars: Capital Expenditures (CAPEX), Operational Expenditures (OPEX), and Revenue Projections.
Understanding Capital Expenditures (CAPEX): The Initial Investment
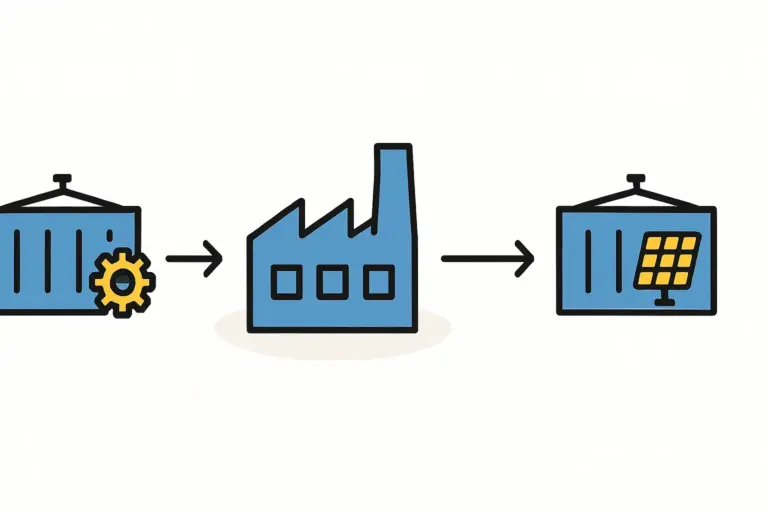
CAPEX represents the total one-time investment needed to establish the production facility and get it up and running. For a new entrant, a turnkey solar production line offers the most predictable and efficient path, as it consolidates most of the required investment under a single, experienced partner.
A typical CAPEX breakdown for a 50 MW turnkey line in Tunisia includes:
- Production Machinery: This is the largest component, covering all stations from cell stringing to final testing. A complete list of required machinery for a 50 MW setup typically includes stringers, laminators, framing machines, and a sun simulator.
- Building and Infrastructure: This includes the cost of acquiring or leasing a suitable facility (approx. 3,000–5,000 sq. meters) and undertaking necessary civil works, such as reinforcing floors and establishing cleanroom environments.
- Logistics and Installation: Costs associated with shipping the machinery from the manufacturer (e.g., from Germany), customs clearance, and on-site installation and commissioning by expert engineers.
- Initial Raw Materials: A starting inventory of solar cells, glass, encapsulants (EVA), and backsheets to cover the first few months of production.
- Training and Certification: Investment in training local staff to operate and maintain the equipment, plus the costs of navigating the module certification process (e.g., IEC 61215, IEC 61730) to ensure market access.
Based on European solar PV equipment provider’s experience with similar projects, the total CAPEX for a 50 MW semi-automated line typically falls between €3.5 and €5 million, a figure that provides a solid foundation for financial planning.
Projecting Operational Expenditures (OPEX): The Ongoing Costs
Once the factory is operational, OPEX determines the cost per module produced and, ultimately, the project’s profitability, making a detailed analysis crucial. Key components include:
- Raw Materials (Bill of Materials – BOM): This is the largest expense, accounting for 70–80% of the production cost per module. It includes solar cells, glass, aluminum frames, junction boxes, encapsulant, and backsheets. Since prices are subject to global market fluctuations, the financial model should include a sensitivity analysis for these variables.
- Labor: Tunisia’s competitive advantage is significant here. The model should account for salaries for around 25–40 employees for a 50 MW line, including operators, technicians, engineers, and administrative staff.
- Utilities: Electricity is a significant cost, particularly for machinery like laminators. The model should use local industrial electricity tariffs (e.g., from the state utility, STEG) to project these costs accurately.
- Maintenance and Spares: A standard allocation of 1–2% of the machinery CAPEX per year is a prudent estimate for spare parts and scheduled maintenance.
- Overhead: This includes rent or depreciation on the building, insurance, administrative costs, and sales and marketing expenses.
Forecasting Revenue Streams: Domestic vs. Export Markets
Revenue projections must be realistic and based on a clear go-to-market strategy. A diversified approach that targets both domestic and export markets can mitigate risk.
- Domestic Market: The primary domestic off-takers in Tunisia include government tenders for utility-scale projects, commercial and industrial (C&I) clients investing in self-consumption, and residential installers. The model should project a conservative market share and use a competitive local price per watt.
- Export Markets: Leveraging Tunisia’s trade agreements, the factory can target neighboring North African countries (Algeria, Libya, Morocco) and Southern Europe. Export pricing may be higher, but the model must account for additional logistics, insurance, and potential tariffs.

A conservative projection, for instance, might assume 60% of production is sold domestically in the first two years, with the export share growing to 50% by year five as the brand builds its reputation for quality.
Securing Financing: The Role of International Financial Institutions (IFIs)
For a project of this scale, securing financing is often the most significant challenge. International Financial Institutions (IFIs) like the African Development Bank (AfDB), the European Investment Bank (EIB), and the World Bank are key potential partners. The AfDB, headquartered in Tunis, has a strong mandate to support renewable energy and industrialization projects across the continent.
To attract IFI funding, a business plan must demonstrate:
- A Bankable Financial Model: The model must be transparent, well-documented, and show a clear path to profitability and debt repayment.
- A Competent Technical Partner: IFIs need assurance that the factory will be built to international standards and produce certified, high-quality modules. Collaborating with a leading European solar specialist provides the credibility you need.
- Market Viability: The revenue projections must be backed by solid market research and, ideally, letters of intent from potential customers.
- Economic Impact: Demonstrating positive contributions to the local economy, such as job creation and technology transfer, is highly valued.
Analyzing Profitability: Key Metrics for Investors
Ultimately, the financial model is used to calculate the key metrics that determine a project’s viability.
Internal Rate of Return (IRR)
The IRR represents the project’s annualized rate of return. It is often the most important metric for comparing this investment against other opportunities. A well-structured solar factory project in a market like Tunisia should target an IRR of 15–25%.
Payback Period
This is the time it takes for the project’s cumulative cash flows to equal the initial investment. Investors typically look for a payback period of 4 to 7 years. A shorter period indicates lower risk and faster returns.
Net Present Value (NPV)
The NPV calculates the value of all future cash flows (both positive and negative) discounted back to the present. A positive NPV indicates that the projected earnings, expressed in today’s currency, exceed the anticipated costs.
A common challenge for new investors, as seen in past European turnkey engineering team projects in North Africa, is accurately forecasting the total landed cost of raw materials. By building realistic logistics costs, import duties, and potential currency fluctuations into the OPEX model from the outset, investors can avoid costly surprises and ensure their financial projections remain robust.
Frequently Asked Questions (FAQ)
-
What is a realistic size for a starter solar module factory?
For a serious industrial venture aiming for both domestic and export markets, a capacity of 20 MW to 50 MW is a common and effective starting point. It achieves a good balance between initial investment and economy of scale. -
Do I need a technical background in photovoltaics to succeed?
No. Most successful investors in this field are business professionals, not solar engineers. The key is to partner with an experienced technical consultant and turnkey provider who can manage the engineering, installation, and training, allowing you to focus on the business aspects. -
How long does it typically take for a solar factory to become profitable?
With a well-executed plan, a factory can reach its break-even point within the first 12–18 months of operation. Overall project profitability, as measured by the payback period, is typically achieved within 4–7 years. -
What are the main financial risks to consider?
The primary risks include fluctuations in raw material prices (especially solar cells), changes in government energy policy or investment incentives, and competition from large-scale international manufacturers. A solid financial model will include a sensitivity analysis to assess the impact of these risks.
The Path Forward
Developing a comprehensive financial model is a non-negotiable first step for any entrepreneur looking to enter the solar manufacturing industry. For a venture in Tunisia, this model must be deeply rooted in local realities while adhering to international standards of bankability.
By systematically analyzing CAPEX, OPEX, and potential revenue streams—and understanding the requirements of financial institutions—an investor can transform a promising idea into a credible, fundable, and ultimately profitable enterprise. The tools and expertise exist to guide this process, ensuring that business acumen, rather than technical expertise, is the primary driver of success.
Download the Tunisia Solar Financial Case Study (PDF)
Author: This case study was prepared by the
turnkey solar module production specialists at J.V.G. Technology GmbH
It is based on real data and consulting experience from J.v.G. projects
worldwide, including installations ranging from 20 MW to 500 MW capacity.