When exploring the solar manufacturing sector, many entrepreneurs focus on initial setup costs—the price of machinery, the building, and technology transfer. While this capital expenditure (CAPEX) is a critical first hurdle, a company’s long-term viability ultimately hinges on its ongoing operational expenditures (OPEX).
An advantageous location can dramatically lower these costs and create a sustainable competitive edge. This analysis presents a transparent financial model for the annual operational costs of a 50 MW solar module factory in Bulgaria. By examining key local economic factors, it provides a realistic projection for investors and demonstrates why strategic site selection is as crucial as the technology itself.
Table of Contents
The Compelling Case for Solar Manufacturing in Bulgaria
As a member of the European Union, Bulgaria offers political stability and unfettered access to the vast European market. Its primary advantage, however, is a cost structure significantly more competitive than most other EU nations. This unique combination of market access and low operational overheads makes it an ideal location to establish a new manufacturing venture.
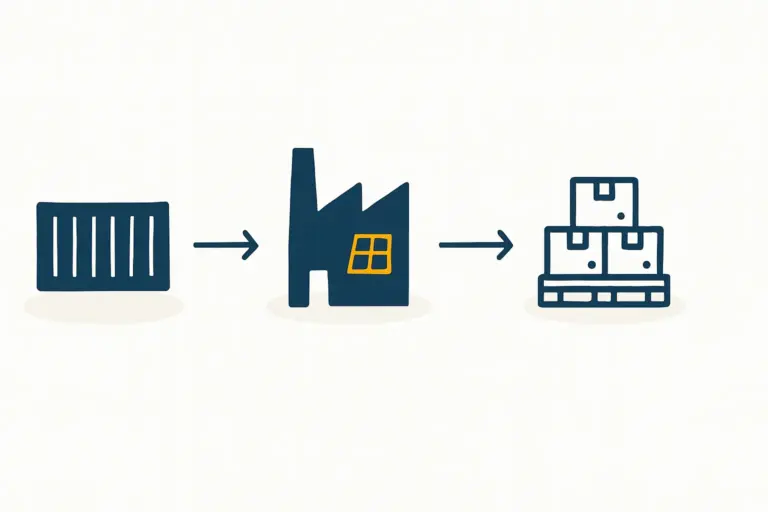
The following breakdown is based on a standard 50 MW turnkey production line, which typically requires a facility of approximately 3,000 square meters and a workforce of 30 to 40 employees.
A Financial Model for Annual Operational Expenditures (OPEX)
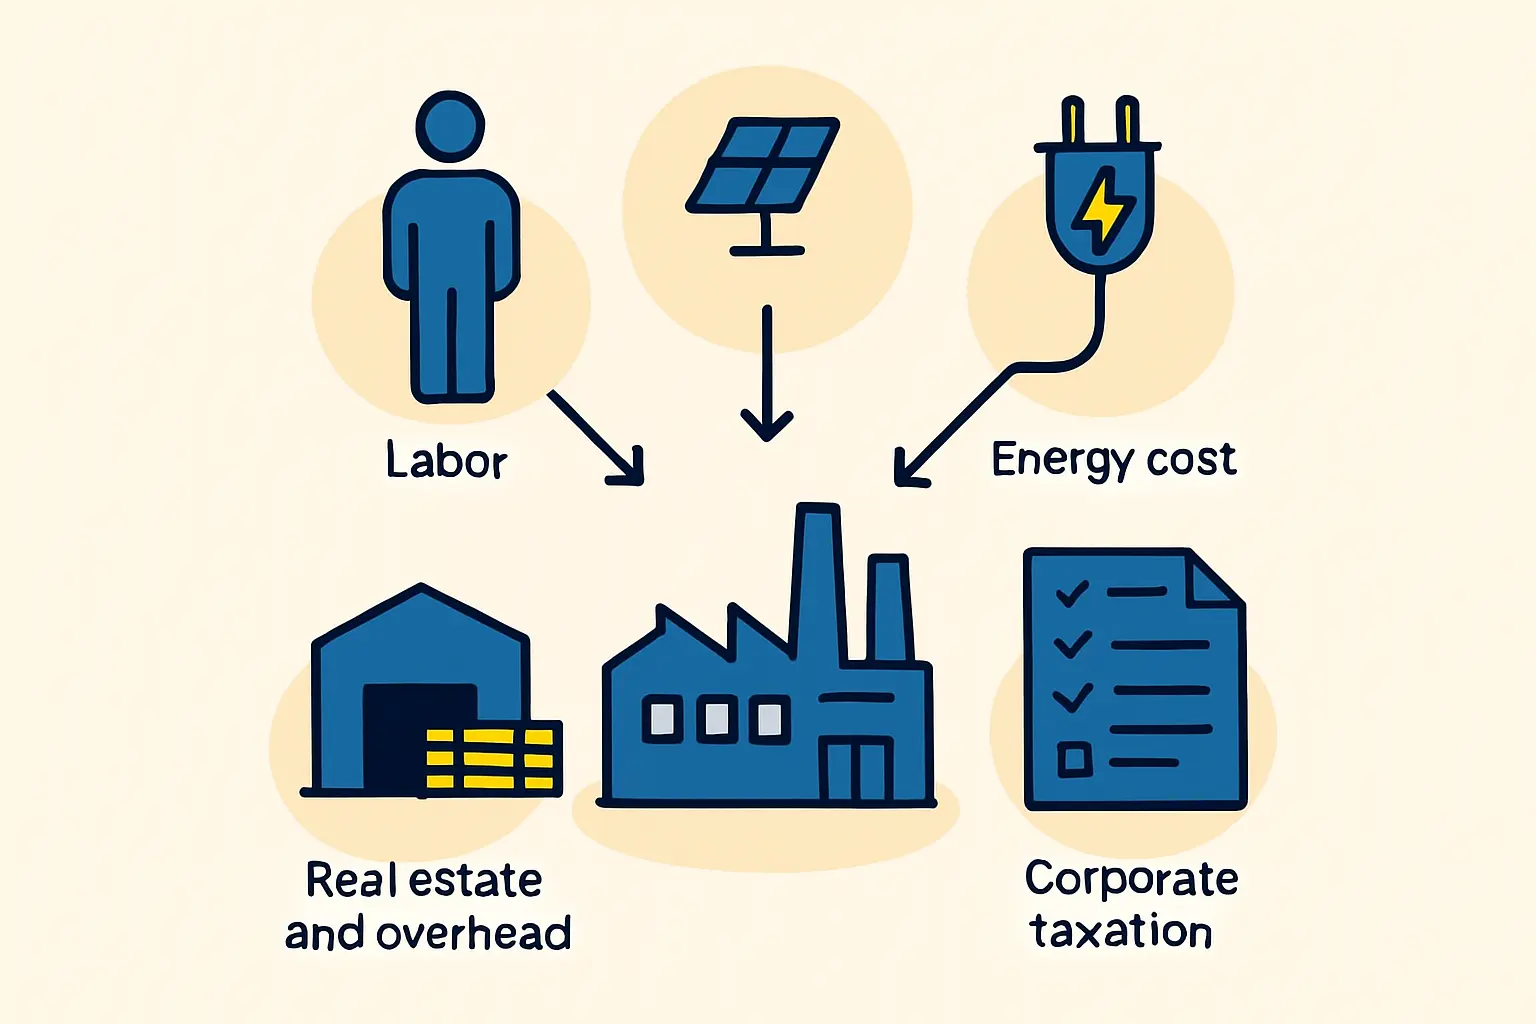
A reliable financial forecast begins with the primary components of OPEX: labor, energy, real estate, and corporate taxation, each of which heavily influences the final cost per module produced.

Labor Costs: Accessing Skilled Talent Efficiently
A semi-automated 50 MW production line relies on a team of skilled operators, technicians, quality control personnel, and administrative staff. The cost of this workforce is often one of the largest items in an operational budget.
According to 2023 Eurostat data, the average annual labor cost per employee in the Bulgarian business economy is approximately €14,082. This figure is the lowest in the European Union, where the average stands at €35,005.
Sample Calculation: For a factory with 40 employees, the estimated annual payroll in Bulgaria would be around €563,280.
For Comparison: The same 40-person team in a country with average EU labor costs would amount to over €1.4 million annually.
This substantial difference in labor expenditure translates directly into a significant cost advantage, allowing for more competitive pricing or higher profit margins.
Energy Consumption: A Critical Cost Driver
The solar module manufacturing process involves several energy-intensive stages, most notably lamination, making the local price of electricity a direct factor in production costs.
In the second half of 2023, the average electricity price for non-household consumers in Bulgaria was €0.0718 per kWh. This is less than half the EU average of €0.1797 per kWh.
Sample Calculation: A 50 MW factory typically consumes approximately 1,500,000 kWh of electricity per year.
Annual Energy Cost in Bulgaria: 1,500,000 kWh x €0.0718/kWh = €107,700.
For Comparison: At the average EU price, the same energy consumption would cost nearly €270,000.
This cost differential not only reduces the factory’s overhead but also enhances its financial resilience against fluctuations in energy markets.
Real Estate and Facility Costs
Securing a suitable production facility is another key operational expense. Bulgaria offers competitive rates for both leasing and purchasing industrial properties.
Industrial Rental Rates: Typically range from €3 to €5 per square meter per month.
Industrial Land Purchase: Prices generally fall between €40 and €60 per square meter.
Sample Annual Lease Cost (3,000 m²): 3,000 m² x €4/m²/month x 12 months = €144,000.
These accessible real estate costs help keep fixed overheads manageable, which is especially important during the initial ramp-up phase of production.
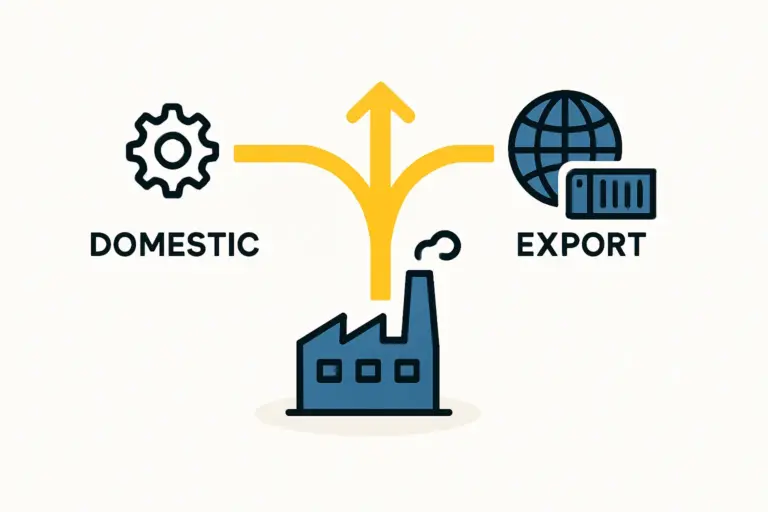
Beyond cost, Bulgaria’s geographic position offers excellent logistical connections to the rest of Europe, the Middle East, and North Africa via road, rail, and its Black Sea ports.
Corporate Taxation and Financial Incentives
The tax environment directly affects a company’s net profitability and its capacity for reinvestment and growth. Bulgaria maintains one of the most favorable corporate tax regimes in Europe.
The country has a flat corporate income tax rate of 10%, substantially lower than the EU average of approximately 21.3%. This simple, low-tax system allows businesses to retain a larger portion of their earnings, accelerating the return on investment.
Putting It All Together: A Sample Annual OPEX Projection
Combining these figures provides a sample projection for the core annual operational expenditures of a 50 MW factory in Bulgaria, excluding the cost of raw materials (Bill of Materials).
- Labor (40 employees): €563,280
- Energy Consumption: €107,700
- Facility Lease: €144,000
- Maintenance, Consumables & Other Overheads (Estimate): €200,000
Total Estimated Annual OPEX (pre-tax): ~€1,014,980
The model demonstrates that a fully operational 50 MW solar module factory can operate within an EU member state for approximately €1 million per year in operational costs—a fraction of what would be required in higher-cost European locations.
Understanding this OPEX profile is essential when evaluating the initial investment. A location with lower operating costs can make a business plan more robust and attractive to financing partners. Experience from J.v.G. Technology projects confirms that a detailed financial model is the cornerstone of a successful turnkey factory setup.
Frequently Asked Questions (FAQ)
Q: What is the typical headcount for a 50 MW factory?
A: A semi-automated 50 MW line generally requires a workforce of 30 to 40 individuals. This includes production line operators, maintenance technicians, quality assurance staff, warehouse personnel, and a small administrative team.
Q: How does OPEX relate to the Bill of Materials (BOM)?
A: OPEX covers the ongoing costs of running the factory, such as salaries, utilities, and rent. The BOM, on the other hand, lists the costs of all the raw materials needed to produce a single solar module (e.g., solar cells, glass, EVA, backsheet, and aluminum frame). The final production cost per module is the sum of the BOM cost and the allocated OPEX per module.
Q: Are there government incentives for solar manufacturing in Bulgaria?
A: As an EU member state, Bulgaria often participates in investment programs aimed at promoting green technology and strategic industries. These can include grants, tax credits, or support for workforce training. A thorough due diligence process with local investment agencies is recommended to identify available opportunities.
Q: How long does it take for a new solar factory to become profitable?
A: The time to reach profitability depends on multiple factors: the initial capital expenditure, operational efficiency, the final cost per watt, prevailing market prices for solar modules, and sales volume. A comprehensive business plan that incorporates detailed CAPEX and OPEX models like this one is essential for accurately projecting the break-even point.