The International Energy Agency (IEA) has reported that solar PV now offers the cheapest electricity in history. For entrepreneurs and business leaders, this is not just an environmental headline; it is a significant market signal. The transition to renewable energy represents one of the most substantial industrial opportunities of this generation. However, turning this opportunity into a viable enterprise requires a clear and realistic financial plan.
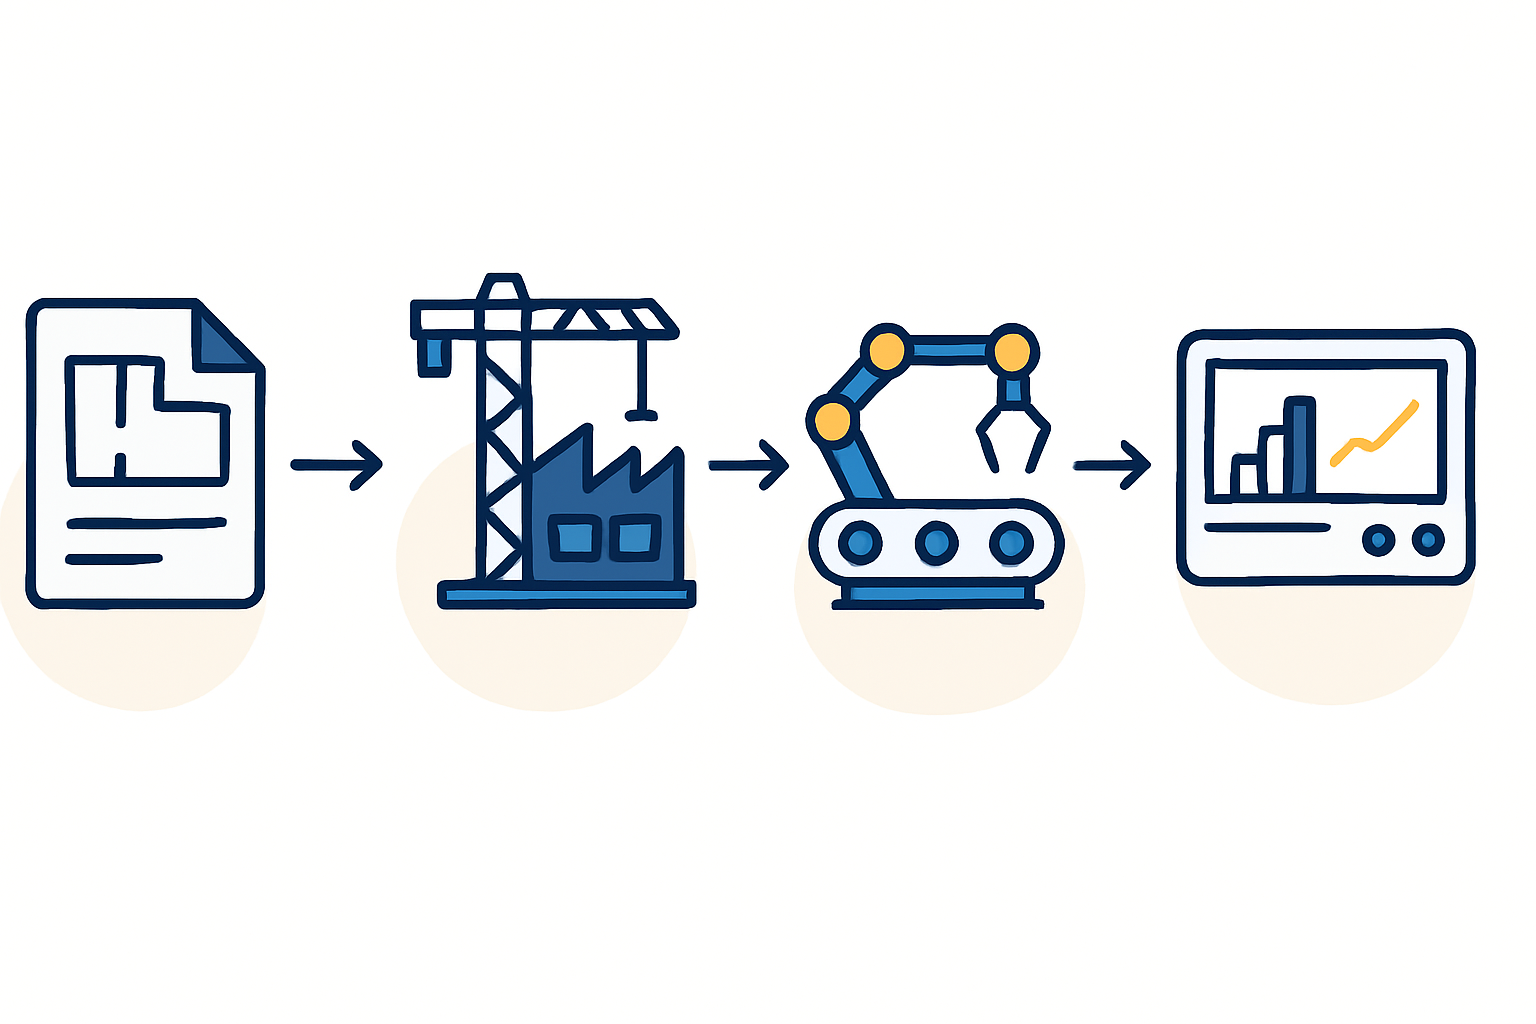
An ambitious vision must be grounded in a solid financial model. For those considering entry into solar module manufacturing, particularly with a small to medium-scale facility (20–50 MW), this model serves as the essential blueprint for investment, operations, and long-term profitability. It is the tool that translates technical specifications into a language that investors, banks, and stakeholders understand.
The Foundation of a Bankable Business Plan: The Financial Model
A financial model for a solar factory is more than a simple spreadsheet of costs. It’s a dynamic simulation of your future business, allowing you to test assumptions, identify potential risks, and understand the key drivers of profitability before committing significant capital. For entities seeking investment—including Foreign Direct Investment (FDI), which UNCTAD reports is increasingly flowing to developing economies for sustainable projects—a well-structured financial model is non-negotiable, as it demonstrates foresight and a thorough understanding of the venture.
This document outlines the primary components of such a model, focusing on the distinct economic landscapes often found in emerging markets across Africa, the Middle East, and the Americas.
Deconstructing the Costs: Capital and Operational Expenditures
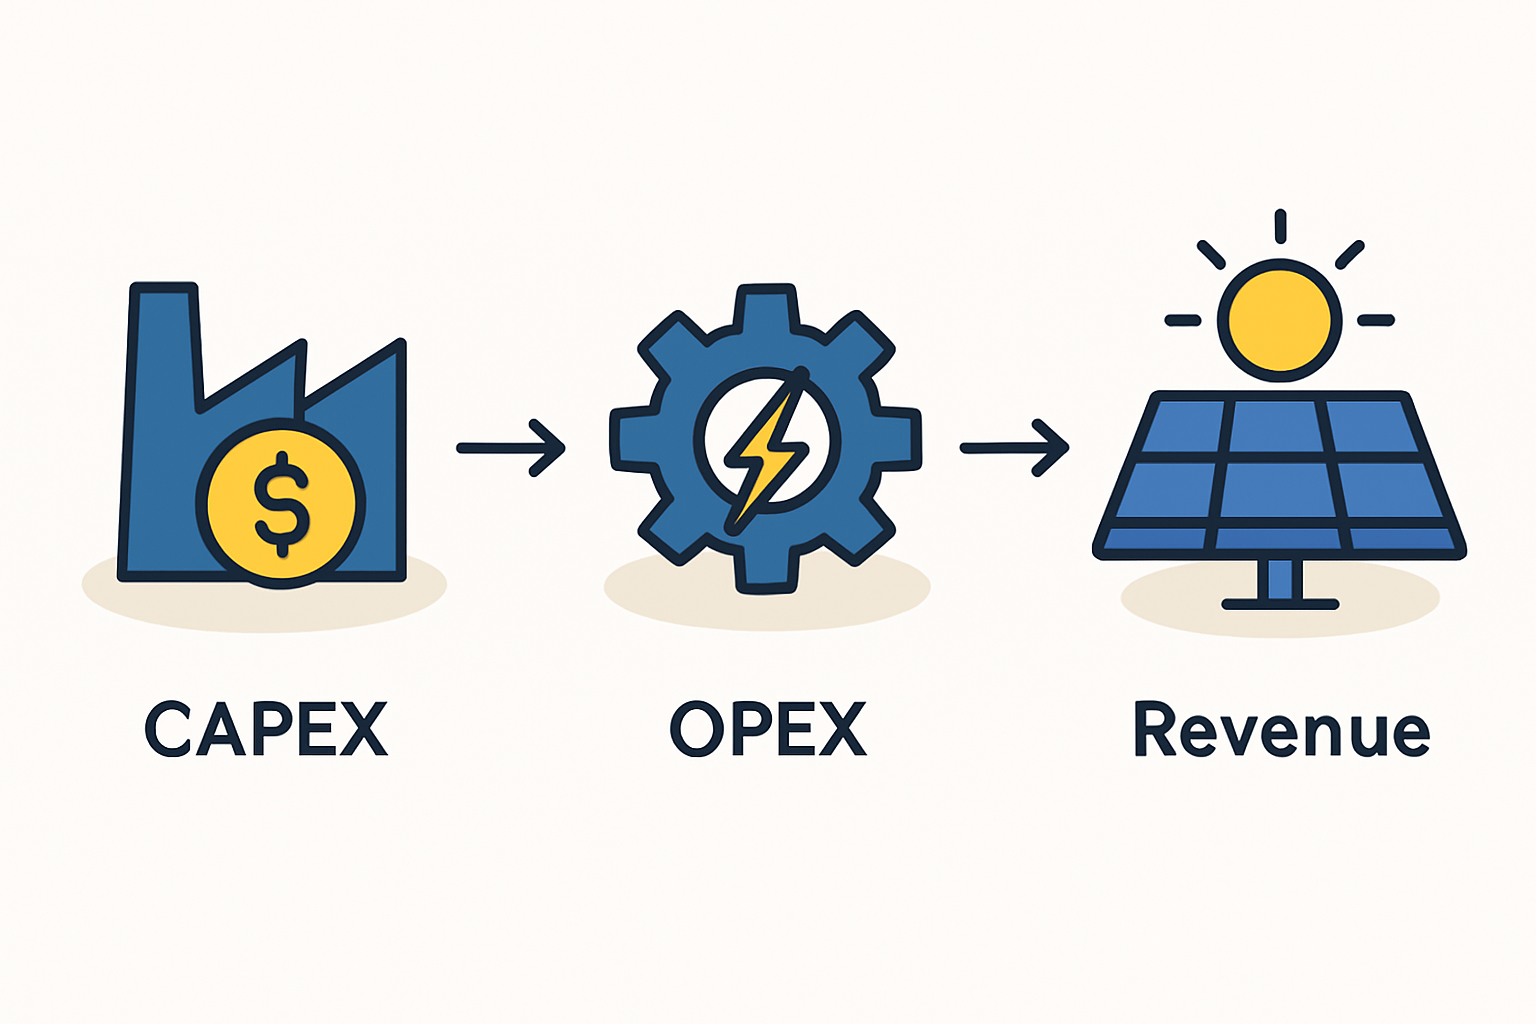
The first step in building any financial model is to separate the one-time initial investments from the recurring costs of running the facility. These are known as Capital Expenditures (CAPEX) and Operational Expenditures (OPEX).
Capital Expenditures (CAPEX): The Initial Investment
CAPEX represents the total upfront investment required to establish the manufacturing facility—a significant cost that demands careful planning.
- Production Machinery: This is the heart of the factory and the largest single expense. Based on J.v.G. Technology’s experience with turnkey projects, the investment for a 20-50 MW turnkey solar manufacturing line typically ranges from $1.5 million to $5 million. The final figure depends heavily on the chosen level of automation and the specific technology.
- Building and Infrastructure: This includes the cost of the land and the construction or renovation of a suitable facility. The facility must meet specific solar factory building requirements, such as floor loading capacity and ceiling height. These costs are highly localized and must be budgeted accordingly.
- Installation, Commissioning, and Training: Allocating funds for professional installation of the equipment and comprehensive training for the local workforce is critical for a smooth start to operations and ensuring long-term quality control.
- Contingency Fund: Experienced project managers typically allocate an additional 10-15% of the total CAPEX as a contingency fund to cover unforeseen expenses and delays.
Operational Expenditures (OPEX): The Ongoing Costs
OPEX includes all recurring costs necessary to run the factory and produce solar modules. Entrepreneurs new to manufacturing often underestimate these costs, and past projects show this oversight can severely impact profitability.
- Raw Materials: This is the largest component of OPEX. A consistent and cost-effective supply chain is paramount. Understanding raw material sourcing for solar panels is essential, as logistics and import duties can significantly affect costs.
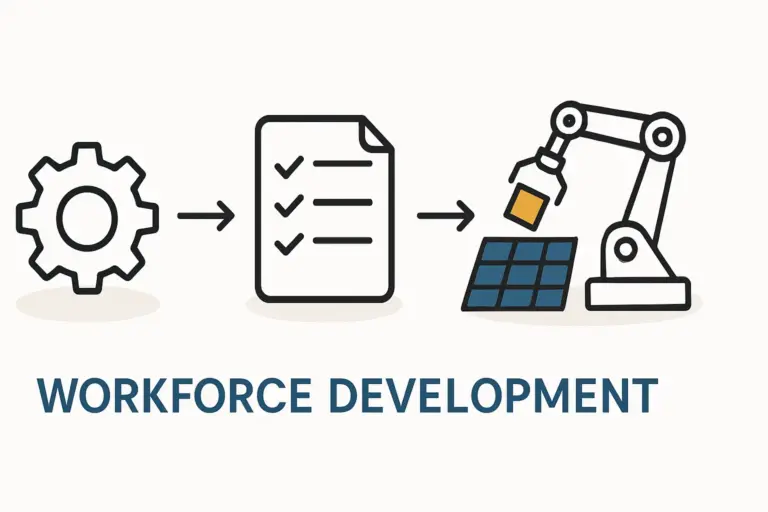
- Labor: The renewable energy sector is a major source of employment. A 2021 IRENA report noted that the sector employed 12.7 million people, with solar PV being the largest employer. For a 20-50 MW factory, a staff of 25-50 employees is typical. While wage costs may be advantageous in certain regions, investing in skilled technicians and quality control managers is crucial.
- Utilities: Electricity and water are significant operational costs. In regions with unstable grids or high industrial electricity tariffs—the World Bank notes costs can exceed $0.20/kWh in many African nations—this expense can be substantial. Some factory owners even plan for a dedicated solar power plant to control their own energy costs.
- Maintenance and Spare Parts: A dedicated budget for preventative maintenance and a stock of critical spare parts is essential for minimizing downtime and maintaining production efficiency.
- Overhead: This includes administrative salaries, sales and marketing, certifications, insurance, and other general business expenses.
Projecting Revenue: Understanding Your Local Market Dynamics
With a clear picture of costs, the next step is to project revenue. These projections are determined not just by your production capacity but by the specific demand and pricing environment of your target market. A key advantage of local manufacturing is the ability to directly address domestic energy needs.
Ready to make big Profits?
The solar Industry is Booming
WE HELP NEWCOMERS to the solar industry start their own solar module production line. Customers can make BIG PROFITS by selling modules and finding investors, without wasting money and time on things they don't need!
Key Revenue Drivers
- Local Electricity Prices and Demand: In markets with high electricity costs and abundant solar irradiation, the business case for solar energy is exceptionally strong. Locally produced modules can offer a competitive alternative to expensive grid power or unreliable diesel generators for commercial, industrial, and residential customers.
- Domestic vs. Export Strategy: A primary advantage is serving the local market, which reduces the shipping costs and import duties faced by foreign competitors. As production scales, exporting to neighboring countries can open up additional revenue streams.
- Product Mix and Pricing: The selling price per watt will depend on the technology (e.g., PERC, TOPCon), efficiency, and certifications (e.g., IEC) of your modules. A clear pricing strategy based on a competitive analysis of the local market is essential.
A Tangible Output Example
To put the production capacity into perspective, a 20 MW factory operating efficiently can produce enough solar modules annually to power approximately 15,000 households, based on J.v.G. project data. This is a powerful metric for communicating the factory’s impact to local governments and communities.
Bringing It All Together: Key Ratios and Projections
Once CAPEX, OPEX, and revenue streams are defined, you can calculate key financial performance indicators:
- Break-Even Point: The production volume at which total revenue equals total costs.
- Payback Period: The time it takes for the initial investment (CAPEX) to be recovered from net cash flows.
- Return on Investment (ROI): A measure of the profitability of the investment.
These metrics form the core of the financial argument for the project and are essential for securing financing.
Frequently Asked Questions (FAQ)
What is the typical payback period for a small solar factory?
The payback period can range from 3 to 7 years, depending heavily on local market prices, operational efficiency, and the initial CAPEX.
How much working capital is needed in addition to CAPEX?
It is advisable to have working capital on hand equivalent to 3-6 months of OPEX to cover the initial period of operation before revenue streams become consistent.
Can a factory be profitable by only serving the domestic market?
Yes, in many emerging markets, the domestic demand for utility-scale, commercial, and residential solar projects is more than sufficient to support a 20-50 MW factory.
How do import duties on raw materials affect the financial model?
Import duties can significantly impact the cost of goods sold. It is crucial to research and include these duties in your OPEX calculations. You should also explore any government incentives for local manufacturing that may mitigate these costs.
What level of automation is recommended for a 20-50 MW line?
A semi-automated line often provides the best balance between investment cost and production quality for this scale. It leverages the advantages of manual labor for certain processes while using automation for critical steps like cell stringing and lamination.
Conclusion: From Model to Manufacturing Reality
A detailed financial model is the first concrete step toward building a successful solar module factory. It transforms a promising market opportunity into a structured, bankable business plan. By carefully projecting costs, realistically forecasting revenue based on local dynamics, and understanding the key financial drivers, entrepreneurs can confidently navigate the path from initial concept to full-scale production.
This process requires a combination of business acumen and technical understanding. For those planning their entry into the solar industry, exploring the total investment needed to start a solar module factory can provide a more comprehensive overview of the entire journey.
Download the PDF for financial modeling of a small-scale solar factory.