
A factory manager walks the production floor at the end of a shift to find a pallet of rejected solar modules. The cause was a subtle miscalibration in the lamination process that went unnoticed for hours, resulting in a significant waste of materials, time, and energy—a cost the business must absorb directly. While common, this scenario is not unavoidable. It’s the result of a reactive approach to quality: finding defects long after they’ve been made.
A more effective strategy shifts the focus from end-of-line inspection to real-time process control managed by the people closest to the production itself: the line operators. Known as Operator-Led Statistical Process Control (SPC), this method transforms quality management from a specialized department’s task into a shared, proactive responsibility.
This article explains the business logic behind this shift, introduces the basic tools involved, and outlines a practical path for empowering your team to prevent defects before they occur.
The Fundamental Shift: Why Post-Production Inspection Fails
The traditional model of quality control relies on “quality by inspection,” where products are manufactured and then passed to a quality assurance team for testing. While essential for final validation, this method has a critical flaw: it identifies problems only after value has been added and resources have been consumed. It’s a safety net, not a preventative measure.
This reactive approach is a major source of inefficiency. In the framework of Lean Manufacturing, it contributes to several of the “8 Wastes,” including:
- Defects: Producing faulty products that require rework or must be scrapped.
- Over-processing: Performing unnecessary work, such as extensive rework on a defective module.
- Unused Talent: Failing to utilize the insights and capabilities of line operators who see the process firsthand every day.
The alternative is “quality by prevention,” a philosophy where monitoring is integrated directly into the manufacturing process. The goal is not just to catch defects but to keep the process so stable that defects aren’t produced in the first place. This is the core purpose of Statistical Process Control.
What is Statistical Process Control (SPC) in Practice?
At its heart, SPC uses simple graphical tools to monitor, control, and improve a process. It allows your team to “listen” to the process and understand its real-time behavior. The primary tool for operators is the control chart.
A control chart is a simple graph that plots a process measurement over time. It distinguishes between two types of variation in any process:
- Common Cause Variation: This is the natural, inherent “noise” or randomness in a process. It is expected and predictable within certain limits.
- Special Cause Variation: This is variation that comes from an external, assignable source—such as a machine malfunction, a change in raw materials, or an operator error. It is unpredictable and signals that the process has changed.
The control chart makes this distinction visible.
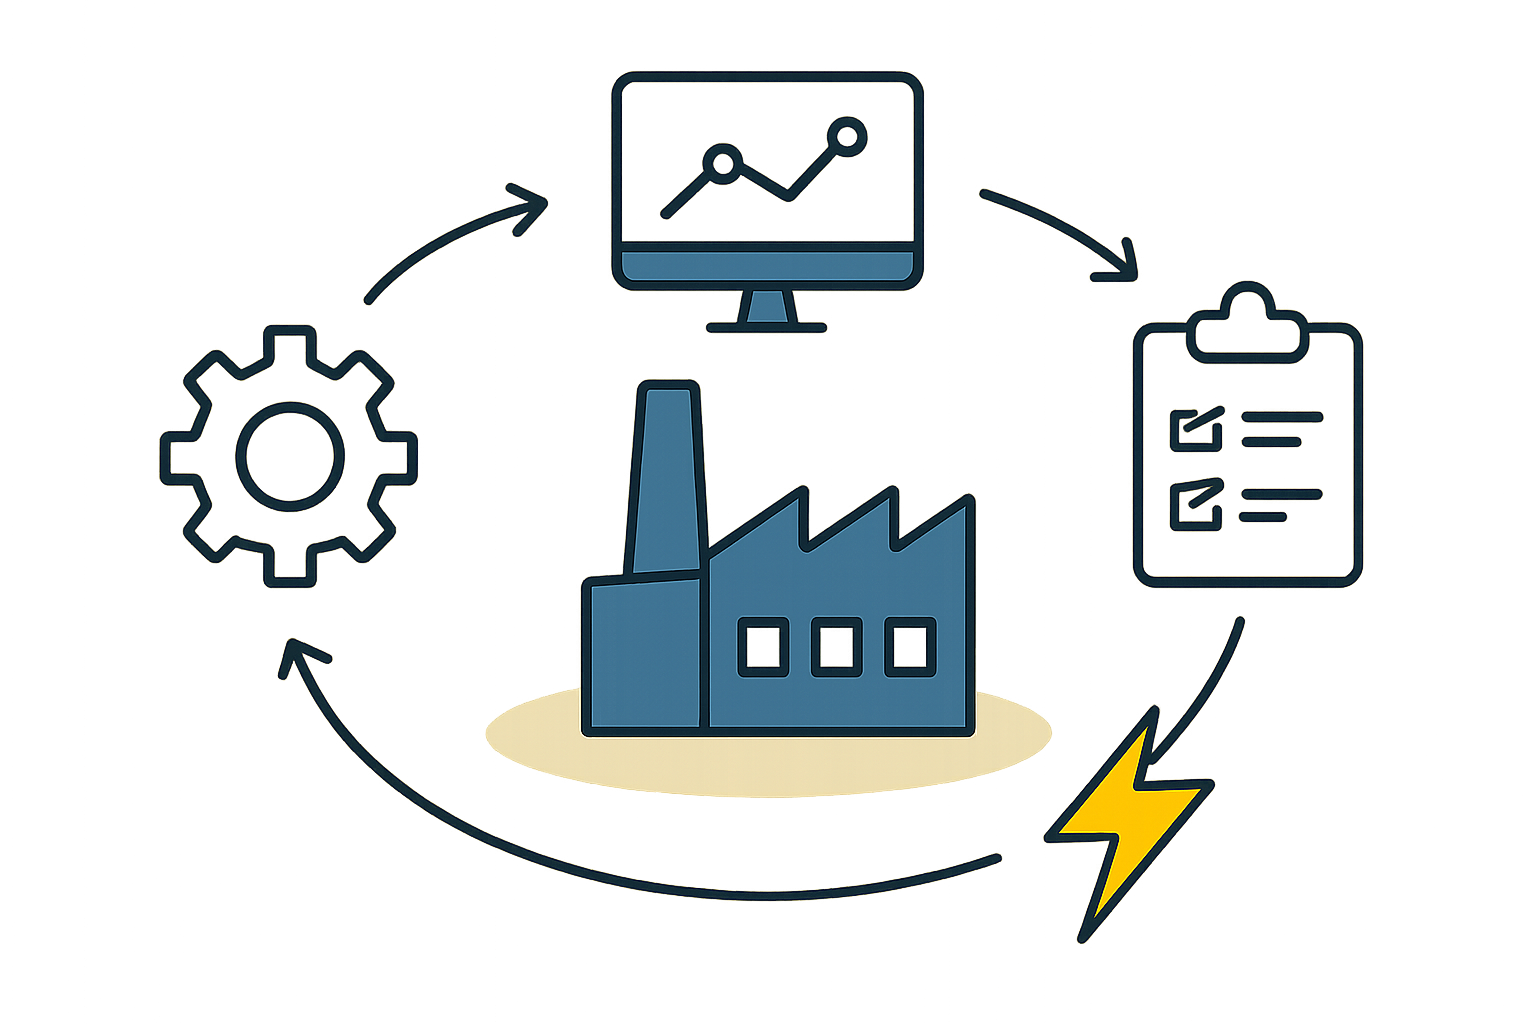
It has three key components:
- Center Line (CL): Represents the statistical average or target for the process.
- Upper Control Limit (UCL) & Lower Control Limit (LCL): These two lines define the bounds of the process’s normal, common cause variation. They are calculated from the process data itself, not set by engineering specifications.
- Data Points: The real-time measurements taken from the process at regular intervals.
As long as the data points fall randomly between the UCL and LCL, the process is considered “in control” and stable. When a point falls outside these limits, it signals that a special cause has occurred. This is the moment for an operator to act—not hours later when a quality inspector finds a defective product.
Empowering Operators: The Core of Operator-Led SPC
The true power of SPC is unleashed when it’s placed in the hands of operators. They are the first to notice changes in machine sounds, material behavior, or environmental conditions. Control charts give them a formal tool to validate their observations and take structured action.
This is a significant cultural shift. The goal is not to blame an operator when a process goes out of control, but to empower them to identify a problem so it can be resolved by a supervisor or engineer. This fosters ownership and leverages the “unused talent” on the factory floor. Engaging operators in process monitoring builds a team actively invested in maintaining consistent [solar panel quality]. The operator’s role transforms from a simple executor of tasks to a guardian of the process.
A Practical Implementation Roadmap
Implementing operator-led SPC doesn’t require a complete operational overhaul. It can be introduced methodically, one process at a time.
Step 1: Identify a Critical Process
Begin with a single, high-impact process where stability is crucial. For a solar module factory, this could be the cell stringer’s soldering temperature, the laminator’s pressure cycle, or the EVA gel content measurement. Focusing on one area allows the team to learn the methodology in a controlled manner.
Step 2: Provide Simple Tools and Training
The initial tools can be as simple as a clipboard with a pre-printed control chart and a calibrated measuring instrument. Training should be highly practical, focusing on three key skills:
- How to take an accurate measurement.
- How to correctly plot the data point on the chart.
- When and how to report an “out-of-control” signal.
The emphasis is on clear, repeatable actions, not complex statistical theory.
Step 3: Define Clear Action Protocols
It’s vital that operators know exactly what to do when a data point falls outside the control limits or shows an unusual pattern. A simple and effective protocol is the “stop and call” rule: the operator stops the process to prevent more defects and immediately notifies a shift supervisor or process engineer. This removes ambiguity and ensures a rapid response.
Step 4: Analyze Data and Celebrate Improvements
The control charts operators create are a valuable source of data. Supervisors and engineers should review them daily to identify trends, investigate special causes, and guide process improvement. When a problem is solved based on an operator’s signal, it’s essential to communicate this success to the entire team. This reinforces the value of their diligence and builds momentum for the program.
The Business Impact: Measurable Gains in Yield and Efficiency
Implementing operator-led SPC translates directly into tangible business results. Studies in similar manufacturing environments have documented defect reductions of up to 60% and improvements in Overall Equipment Effectiveness (OEE) of 15% or more.
For a solar module manufacturer, this means:
- Reduced Material Waste: Fewer scrapped cells, glass sheets, and encapsulants.
- Higher Yield: A greater percentage of raw materials are converted into saleable A-grade modules.
- Lower Rework Costs: Less time and labor spent fixing correctable defects.
- Improved Predictability: A stable process is a predictable one, making production planning more reliable.
These efficiencies directly impact the overall [cost to produce solar panels], strengthening the factory’s competitive position. Based on experience from J.v.G. turnkey projects, factories that successfully implement operator-led SPC often see a noticeable improvement in their yield rate within the first six months.
Frequently Asked Questions (FAQ)
Do my operators need to be statisticians?
No. Operators need to be trained to perform two simple tasks: accurately plotting a data point and recognizing when that point falls outside the pre-established control limits. The deeper statistical analysis is typically handled by supervisors and process engineers.
How much training is required?
Basic training for a single process can often be completed in a few hours of on-the-floor instruction. This should be followed by regular coaching from supervisors to ensure the method is being applied correctly and to address any questions.
What if my process is already highly automated?
SPC is just as valuable, if not more so, in automated environments. Data can be collected electronically from machine sensors and displayed on HMI screens in real-time control charts. The operator’s role shifts from manual data collection to actively monitoring these digital charts and responding to automated alerts.
Is this suitable for a new factory?
Absolutely. The start-up phase of a factory is the ideal time to establish a culture of quality and proactive process management. Integrating these principles from day one is far more effective than trying to change established habits later. These quality systems are a critical component of a robust [solar panel manufacturing business plan].
Conclusion: Building a Culture of Continuous Improvement
Operator-led SPC is more than a quality control tool; it’s a management philosophy built on the principle that the person closest to a process is in the best position to control it. By shifting responsibility for process stability from a separate department to the operators themselves, a company empowers its entire workforce to contribute to quality.
This approach transforms the factory floor from a place where defects are simply found into one where they are actively prevented. The result is a more efficient, cost-effective, and reliable manufacturing operation, driven by an engaged and empowered team. For entrepreneurs planning a new facility, integrating these principles from the start is a key strategic advantage. The pvknowhow.com e-course provides further structured guidance on establishing robust quality systems.